
5.7: Savings and the Financial Systems
- Page ID
- 1727
\( \newcommand{\vecs}[1]{\overset { \scriptstyle \rightharpoonup} {\mathbf{#1}} } \)
\( \newcommand{\vecd}[1]{\overset{-\!-\!\rightharpoonup}{\vphantom{a}\smash {#1}}} \)
\( \newcommand{\dsum}{\displaystyle\sum\limits} \)
\( \newcommand{\dint}{\displaystyle\int\limits} \)
\( \newcommand{\dlim}{\displaystyle\lim\limits} \)
\( \newcommand{\id}{\mathrm{id}}\) \( \newcommand{\Span}{\mathrm{span}}\)
( \newcommand{\kernel}{\mathrm{null}\,}\) \( \newcommand{\range}{\mathrm{range}\,}\)
\( \newcommand{\RealPart}{\mathrm{Re}}\) \( \newcommand{\ImaginaryPart}{\mathrm{Im}}\)
\( \newcommand{\Argument}{\mathrm{Arg}}\) \( \newcommand{\norm}[1]{\| #1 \|}\)
\( \newcommand{\inner}[2]{\langle #1, #2 \rangle}\)
\( \newcommand{\Span}{\mathrm{span}}\)
\( \newcommand{\id}{\mathrm{id}}\)
\( \newcommand{\Span}{\mathrm{span}}\)
\( \newcommand{\kernel}{\mathrm{null}\,}\)
\( \newcommand{\range}{\mathrm{range}\,}\)
\( \newcommand{\RealPart}{\mathrm{Re}}\)
\( \newcommand{\ImaginaryPart}{\mathrm{Im}}\)
\( \newcommand{\Argument}{\mathrm{Arg}}\)
\( \newcommand{\norm}[1]{\| #1 \|}\)
\( \newcommand{\inner}[2]{\langle #1, #2 \rangle}\)
\( \newcommand{\Span}{\mathrm{span}}\) \( \newcommand{\AA}{\unicode[.8,0]{x212B}}\)
\( \newcommand{\vectorA}[1]{\vec{#1}} % arrow\)
\( \newcommand{\vectorAt}[1]{\vec{\text{#1}}} % arrow\)
\( \newcommand{\vectorB}[1]{\overset { \scriptstyle \rightharpoonup} {\mathbf{#1}} } \)
\( \newcommand{\vectorC}[1]{\textbf{#1}} \)
\( \newcommand{\vectorD}[1]{\overrightarrow{#1}} \)
\( \newcommand{\vectorDt}[1]{\overrightarrow{\text{#1}}} \)
\( \newcommand{\vectE}[1]{\overset{-\!-\!\rightharpoonup}{\vphantom{a}\smash{\mathbf {#1}}}} \)
\( \newcommand{\vecs}[1]{\overset { \scriptstyle \rightharpoonup} {\mathbf{#1}} } \)
\(\newcommand{\longvect}{\overrightarrow}\)
\( \newcommand{\vecd}[1]{\overset{-\!-\!\rightharpoonup}{\vphantom{a}\smash {#1}}} \)
\(\newcommand{\avec}{\mathbf a}\) \(\newcommand{\bvec}{\mathbf b}\) \(\newcommand{\cvec}{\mathbf c}\) \(\newcommand{\dvec}{\mathbf d}\) \(\newcommand{\dtil}{\widetilde{\mathbf d}}\) \(\newcommand{\evec}{\mathbf e}\) \(\newcommand{\fvec}{\mathbf f}\) \(\newcommand{\nvec}{\mathbf n}\) \(\newcommand{\pvec}{\mathbf p}\) \(\newcommand{\qvec}{\mathbf q}\) \(\newcommand{\svec}{\mathbf s}\) \(\newcommand{\tvec}{\mathbf t}\) \(\newcommand{\uvec}{\mathbf u}\) \(\newcommand{\vvec}{\mathbf v}\) \(\newcommand{\wvec}{\mathbf w}\) \(\newcommand{\xvec}{\mathbf x}\) \(\newcommand{\yvec}{\mathbf y}\) \(\newcommand{\zvec}{\mathbf z}\) \(\newcommand{\rvec}{\mathbf r}\) \(\newcommand{\mvec}{\mathbf m}\) \(\newcommand{\zerovec}{\mathbf 0}\) \(\newcommand{\onevec}{\mathbf 1}\) \(\newcommand{\real}{\mathbb R}\) \(\newcommand{\twovec}[2]{\left[\begin{array}{r}#1 \\ #2 \end{array}\right]}\) \(\newcommand{\ctwovec}[2]{\left[\begin{array}{c}#1 \\ #2 \end{array}\right]}\) \(\newcommand{\threevec}[3]{\left[\begin{array}{r}#1 \\ #2 \\ #3 \end{array}\right]}\) \(\newcommand{\cthreevec}[3]{\left[\begin{array}{c}#1 \\ #2 \\ #3 \end{array}\right]}\) \(\newcommand{\fourvec}[4]{\left[\begin{array}{r}#1 \\ #2 \\ #3 \\ #4 \end{array}\right]}\) \(\newcommand{\cfourvec}[4]{\left[\begin{array}{c}#1 \\ #2 \\ #3 \\ #4 \end{array}\right]}\) \(\newcommand{\fivevec}[5]{\left[\begin{array}{r}#1 \\ #2 \\ #3 \\ #4 \\ #5 \\ \end{array}\right]}\) \(\newcommand{\cfivevec}[5]{\left[\begin{array}{c}#1 \\ #2 \\ #3 \\ #4 \\ #5 \\ \end{array}\right]}\) \(\newcommand{\mattwo}[4]{\left[\begin{array}{rr}#1 \amp #2 \\ #3 \amp #4 \\ \end{array}\right]}\) \(\newcommand{\laspan}[1]{\text{Span}\{#1\}}\) \(\newcommand{\bcal}{\cal B}\) \(\newcommand{\ccal}{\cal C}\) \(\newcommand{\scal}{\cal S}\) \(\newcommand{\wcal}{\cal W}\) \(\newcommand{\ecal}{\cal E}\) \(\newcommand{\coords}[2]{\left\{#1\right\}_{#2}}\) \(\newcommand{\gray}[1]{\color{gray}{#1}}\) \(\newcommand{\lgray}[1]{\color{lightgray}{#1}}\) \(\newcommand{\rank}{\operatorname{rank}}\) \(\newcommand{\row}{\text{Row}}\) \(\newcommand{\col}{\text{Col}}\) \(\renewcommand{\row}{\text{Row}}\) \(\newcommand{\nul}{\text{Nul}}\) \(\newcommand{\var}{\text{Var}}\) \(\newcommand{\corr}{\text{corr}}\) \(\newcommand{\len}[1]{\left|#1\right|}\) \(\newcommand{\bbar}{\overline{\bvec}}\) \(\newcommand{\bhat}{\widehat{\bvec}}\) \(\newcommand{\bperp}{\bvec^\perp}\) \(\newcommand{\xhat}{\widehat{\xvec}}\) \(\newcommand{\vhat}{\widehat{\vvec}}\) \(\newcommand{\uhat}{\widehat{\uvec}}\) \(\newcommand{\what}{\widehat{\wvec}}\) \(\newcommand{\Sighat}{\widehat{\Sigma}}\) \(\newcommand{\lt}{<}\) \(\newcommand{\gt}{>}\) \(\newcommand{\amp}{&}\) \(\definecolor{fillinmathshade}{gray}{0.9}\)Savings & the Financial Systems
Companies can raise early-stage financial capital in several ways: from their owners’ or managers’ personal savings, or credit cards and from private investors like angel investors and venture capital firms.
Universal Generalizations
- Banks and other financial institutions provide opportunities for saving and investing by individuals, which in turn provides opportunities for businesses to borrow and expand.
Guiding Questions
- Why is it important for individuals to save and to invest?
- In addition to the depository institutions, what non-depository institutions exist to serve as financial intermediaries?
- What effect do interest rates have on levels of investment?
- How do you assess risk before making an investment?
- What types of accounts are offered to consumers? What are the costs associated with these accounts?
Video: Basics of Investing
There are only two things you can do with money: save it or spend it. "Saving" means the absence of spending, while "savings" refers to dollars that are made available when people abstain from consumption. For an economic system to grow, there must be both saving and spending. People must save so that banks can lend the money to those that need to borrow it to buy things such as cars, homes, or pay for college or vacations. In addition, banks lend money to those who own businesses who need extra money to buy tools, equipment, build additional factories, hire more employees, or expand their business. Savings makes economic growth possible.
Financial System
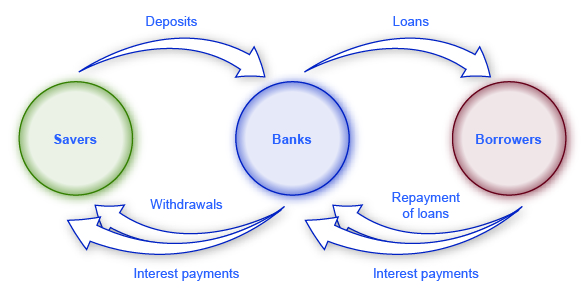
The financial system, a network of savers, investors and financial institutions, works together to transfer savings to those that need it and that in turn helps the economy grow.
The Financial System
(Source: http://cnx.org/resources/6665eb13ada...on_C27_002.jpg)
Financial Assets
There are various ways that people save and invest. A certificate of deposit (CD) is an interest-bearing loan to a bank, or the government, or a corporation. Because this is a type of investment, it is also called a financial asset or a claim on the property and the income of the borrower. This asset has value and it specifies the amount of money loaned and the terms of that loan, such as interest rate and due date. A certificate of deposit can be set up for a short amount of time, such as six months, or longer depending on the terms.
Financial Intermediaries
A financial intermediary is a bank, however, there are non-financial intermediaries that also allow people to save and make loans to members. Households and businesses are the most important savers in the circular flow of economic activity, while governments and businesses are the largest borrowers. The smooth operation of these financial intermediaries ensures that savers have a place to save and borrowers have a place to go to get funds.
Examples of Non-financial Intermediaries
Finance companies are firms that specialize in making loans directly to consumers and in buying installment contracts from members who sell goods on credit. Merchants cannot wait for years for their customers to pay off high-cost items on an installment plan. Instead, the merchant sells the customer's installment contract to a finance company for a lump sum. This allows a merchant to advertise instant credit without having to carry the loan the full term or accept the risk involved in the loan. A good example of a finance company would be one that works with automobile manufacturers or car lots such as: Bank of America Merrill Lynch Dealer Financial Services, Chase Auto Finance, and Ford Motor Credit Company.
To read more about financial companies read the Forbes article America's 50 Most Trustworthy Financial Companies.
A life insurance company's primary purpose is to provide financial protection for survivors of the insured, however after insurance policies have been paid out by the company, it tends to have a great deal of cash on hand. This cash it then lent to others, or those people who have insurance policies may borrow against the policy based on what they have already given to the company. The loan from the insurance company must be paid back, plus interest.
A mutual fund is a company that sells stock in itself to individual investors and then invests the money it receives in stocks and bonds issued by other corporations. Mutual fund stockholders receive dividends earned from the mutual fund's investment. Stockholders can also sell their mutual fund shares for a profit just like other stocks. Mutual funds allow people to diversify without taking too much of a risk. The mutual fund company's assets are calculated by taking the net value of the mutual fund and dividing it by the number of shares issued by the mutual fund to find its market value.
Pension funds are set up to plan for the retirement or disability of employees. Workers have a portion or percentage of their pay withheld and placed in the pension fund. The managers of the fund then take that money and invest it in stocks, bonds, and mutual funds to earn more money. A portion of the pension fund is paid out to those employees who have retired or are no longer working for the company. A pension plan helps workers set aside money that they will need when they retire.
REIT is a real estate investment trust. It is a company that is organized primarily to make loans to construction companies that build homes. This type of non-financial intermediary helps provide billions of dollars for home construction.
No matter which type of financial or non-financial intermediary consumers use, the purpose is still the same, help consumers borrow available funds and participate in the circular flow of economic activity.
Demand and Supply in Financial Markets
United States’ households and businesses saved almost $2.9 trillion in 2012. Where did that savings go and what was it used for? Some of the savings ended up in banks, which in turn loaned the money to individuals or businesses that wanted to borrow money. Some was invested in private companies or loaned to government agencies that wanted to borrow money to raise funds for purposes like building roads or mass transit. Some firms reinvested their savings in their own businesses.
In this section, we will determine how the demand and supply model links those who wish to supply financial capital (i.e., savings) with those who demand financial capital (i.e., borrowing). Those who save money (or make financial investments, which is the same thing), whether individuals or businesses are on the supply side of the financial market. Those who borrow money are on the demand side of the financial market.
Who Demands and Who Supplies in Financial Markets?
In any market, the price is what suppliers receive and what demanders pay. In financial markets, those who supply financial capital through saving expect to receive a rate of return, while those who demand financial capital by receiving funds expect to pay a rate of return. This rate of return can come in a variety of forms, depending on the type of investment.
The simplest example of a rate of return is the interest rate. For example, when you supply money into a savings account at a bank, you receive interest on your deposit. The interest paid to you as a percent of your deposits is the interest rate. Similarly, if you demand a loan to buy a car or a computer, you will need to pay interest on the money you borrow.
Let’s consider the market for borrowing money with credit cards. In 2012, more than 180 million Americans were cardholders. Credit cards allow you to borrow money from the card's issuer, and pay back the borrowed amount plus interest, though most allow you a period of time in which you can repay the loan without paying interest. A typical credit card interest rate ranges from 12% to 18% per year. In 2010, Americans had about $900 billion outstanding in credit card debts. About half of U.S. families with credit cards report that they almost always pay the full balance on time, but one-quarter of U.S. families with credit cards say that they “hardly ever” pay off the card in full. In fact, as of March 2013, CreditCards.com reported that nearly two out of every five Americans (39%) carry credit card debt from one month to the next. Let’s say that, on average, the annual interest rate for credit card borrowing is 15% per year. So, Americans pay tens of billions of dollars every year in interest on their credit cards—plus basic fees for the credit card or fees for late payments.
Figure 2 illustrates demand and supply in the financial market for credit cards. The horizontal axis of the financial market shows the quantity of money that is loaned or borrowed in this market. The vertical or price axis shows the rate of return, which in the case of credit card borrowing can be measured with an interest rate. Table 1 shows the quantity of financial capital that consumers demand at various interest rates and the quantity that credit card firms (often banks) are willing to supply.
Demand and Supply for Borrowing Money with Credit Cards
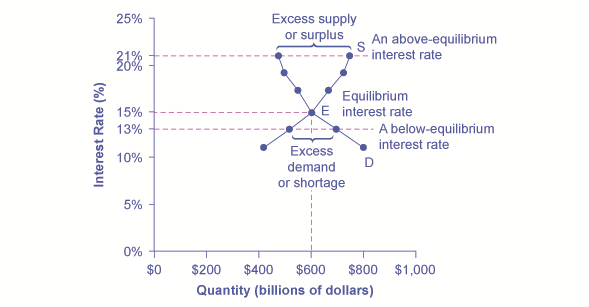
In this market for credit card borrowing, the demand curve (D) for borrowing financial capital intersects the supply curve (S) for lending financial capital at equilibrium €. At the equilibrium, the interest rate (the “price” in this market) is 15% and the quantity of financial capital being loaned and borrowed is $600 billion. The equilibrium price is where the quantity demanded and the quantity supplied are equal. At an above-equilibrium interest rate like 21%, the quantity of financial capital supplied would increase to $750 billion, but the quantity demanded would decrease to $480 billion. At a below-equilibrium interest rate like 13%, the quantity of financial capital demanded would increase to $700 billion, but the quantity of financial capital supplied would decrease to $510 billion.
| Interest Rate (%) | Quantity of Financial Capital Demanded (Borrowing) ($ billions) | Quantity of Financial Capital Supplied (Lending) ($ billions) |
| 11 | $800 | $420 |
| 13 | $700 | $510 |
| 15 | $600 | $600 |
| 17 | $550 | $660 |
| 19 | $500 | $720 |
| 21 | $480 | $750 |
The laws of demand and supply continue to apply in the financial markets. According to the law of demand, a higher rate of return (that is, a higher price) will decrease the quantity demanded. As the interest rate rises, consumers will reduce the quantity that they borrow. According to the law of supply, higher price increases the quantity supplied. Consequently, as the interest rate paid on credit card borrowing rises, more firms will be eager to issue credit cards and to encourage customers to use them. Conversely, if the interest rate on credit cards falls, the quantity of financial capital supplied in the credit card market will decrease and the quantity demanded will fall.
Equilibrium in Financial Markets
In the financial market for credit cards shown in Figure 2, the supply curve (S) and the demand curve (D) cross at the equilibrium point (E). The equilibrium occurs at an interest rate of 15%, where the quantity of funds demanded and the quantity supplied are equal at an equilibrium quantity of $600 billion.
If the interest rate (remember, this measures the “price” in the financial market) is above the equilibrium level, then an excess supply, or a surplus, of financial capital will arise in this market. For example, at an interest rate of 21%, the quantity of funds supplied increases to $750 billion, while the quantity demanded decreases to $480 billion. At this above-equilibrium interest rate, firms are eager to supply loans to credit card borrowers, but relatively few people or businesses wish to borrow. As a result, some credit card firms will lower the interest rates (or other fees) they charge to attract more business. This strategy will push the interest rate down toward the equilibrium level.
If the interest rate is below the equilibrium, then excess demand or a shortage of funds occurs in this market. At an interest rate of 13%, the quantity of funds credit card borrowers demand increases to $700 billion; but the quantity credit card firms are willing to supply is only $510 billion. In this situation, credit card firms will perceive that they are overloaded with eager borrowers and conclude that they have an opportunity to raise interest rates or fees. The interest rate will face economic pressures to creep up toward the equilibrium level.
Shifts in Demand and Supply in Financial Markets
Those who supply financial capital face two broad decisions: how much to save, and how to divide up their savings among different forms of financial investments. We will discuss each of these in turn.
Participants in financial markets must decide when they prefer to consume goods: now or in the future. Economists call this inter-temporal decision making because it involves decisions across time. Unlike a decision about what to buy from the grocery store, decisions about investment or saving are made across a period of time, sometimes a long period.
Most workers save for retirement because their income in the present is greater than their needs, while the opposite will be true once they retire. So they save today and supply financial markets. If their income increases, they save more. If their perceived situation in the future changes, they change the amount of their saving. For example, there is some evidence that Social Security, the program that workers pay into in order to qualify for government checks after retirement, has tended to reduce the quantity of financial capital that workers save. If this is true, Social Security has shifted the supply of financial capital at any interest rate to the left.
By contrast, many college students need money today when their income is low (or nonexistent) to pay their college expenses. As a result, they borrow today and demand from financial markets. Once they graduate and become employed, they will pay back the loans. Individuals borrow money to purchase homes or cars. A business seeks financial investment so that it has the funds to build a factory or invest in a research and development project that will not pay off for five years, ten years, or even more. So when consumers and businesses have greater confidence that they will be able to repay in the future, the quantity demanded of financial capital at any given interest rate will shift to the right.
For example, in the technology boom of the late 1990s, many businesses became extremely confident that investments in new technology would have a high rate of return, and their demand for financial capital shifted to the right. Conversely, during the Great Recession of 2008 and 2009, their demand for financial capital at any given interest rate shifted to the left.
To this point, we have been looking at saving in total. Now let us consider what affects saving in different types of financial investments. In deciding between different forms of financial investments, suppliers of financial capital will have to consider the rates of return and the risks involved. Rate of return is a positive attribute of investments, but risk is a negative. If Investment A becomes more risky, or the return diminishes, then savers will shift their funds to Investment B—and the supply curve of financial capital for Investment A will shift back to the left while the supply curve of capital for Investment B shifts to the right.
Price Ceilings in Financial Markets: Usury Laws
As we noted earlier, more than 180 million Americans own credit cards, and their interest payments and fees total tens of billions of dollars each year. It is little wonder that political pressures sometimes arise for setting limits on the interest rates or fees that credit card companies charge. The firms that issue credit cards, including banks, oil companies, phone companies, and retail stores, respond that the higher interest rates are necessary to cover the losses created by those who borrow on their credit cards and who do not repay on time or at all. These companies also point out that cardholders can avoid paying interest if they pay their bills on time.
Consider the credit card market as illustrated in Figure 3. In this financial market, the vertical axis shows the interest rate (which is the price in the financial market). Demanders in the credit card market are households and businesses; suppliers are the companies that issue credit cards. This figure does not use specific numbers, which would be hypothetical in any case, but instead focuses on the underlying economic relationships. Imagine a law imposes a price ceiling that holds the interest rate charged on credit cards at the rate Rc, which lies below the interest rate R0 that would otherwise have prevailed in the market. The price ceiling is shown by the horizontal dashed line in Figure 3. The demand and supply model predicts that at the lower price ceiling interest rate, the quantity demanded of credit card debt will increase from its original level of Q0 to Qd; however, the quantity supplied of credit card debt will decrease from the original Q0 to Qs. At the price ceiling (Rc), quantity demanded will exceed quantity supplied. Consequently, a number of people who want to have credit cards and are willing to pay the prevailing interest rate will find that companies are unwilling to issue cards to them. The result will be a credit shortage.
Credit Card Interest Rates: Another Price Ceiling Example

The original intersection of demand D and supply S occurs at equilibrium E0. However, a price ceiling is set at the interest rate Rc, below the equilibrium interest rate R0, and so the interest rate cannot adjust upward to the equilibrium. At the price ceiling, the quantity demanded, Qd, exceeds the quantity supplied, Qs. There is excess demand, also called a shortage.
Many states do have usury laws, which impose an upper limit on the interest rate that lenders can charge. However, in many cases these upper limits are well above the market interest rate. For example, if the interest rate is not allowed to rise above 30% per year, it can still fluctuate below that level according to market forces. A price ceiling that is set at a relatively high level is non-binding, and it will have no practical effect unless the equilibrium price soars high enough to exceed the price ceiling.
In the demand and supply analysis of financial markets, the “price” is the rate of return or the interest rate received. The quantity is measured by the money that flows from those who supply financial capital to those who demand it.
Two factors can shift the supply of financial capital to a certain investment: if people want to alter their existing levels of consumption, and if the riskiness or return on one investment changes relative to other investments. Factors that can shift demand for capital include business confidence and consumer confidence in the future—since financial investments received in the present are typically repaid in the future.

Many people choose to purchase their home rather than rent. This chapter explores how the global financial crisis has influenced home ownership. (Credit: modification of work by Diana Parkhouse/Flickr Creative Commons)
The Housing Bubble and the Financial Crisis of 2007
In 2006, housing equity in the United States peaked at $13 trillion. That means that the market prices of homes, less what was still owed on the loans used to buy these houses, equaled $13 trillion. This was a very good number, since the equity represented the value of the financial asset most U.S. citizens owned.
However, by 2008 this number had gone down to $8.8 trillion, and it declined further still in 2009. Combined with the decline in value of other financial assets held by U.S. citizens, by 2010, U.S. homeowners’ wealth had declined by $14 trillion! This is a staggering result, and it affected millions of lives: people had to alter their retirement decisions, housing decisions, and other important consumption decisions. Just about every other large economy in the world suffered a decline in the market value of financial assets, as a result of the global financial crisis of 2008–2009.
This chapter will explain why people buy houses (other than as a place to live), why they buy other types of financial assets, and why businesses sell those financial assets in the first place. The chapter will also give us insight into why financial markets and assets go through boom and bust cycles like the one described here.
When a firm needs to buy new equipment or build a new facility, it often must go to the financial market to raise funds. Usually firms will add capacity during an economic expansion when profits are on the rise and consumer demand is high. Business investment is one of the critical ingredients needed to sustain economic growth. Even in the sluggish economy of 2009, U.S. firms invested $1.4 trillion in new equipment and structures, in the hope that these investments would generate profits in the years ahead.
Between the end of the recession in 2009 through the second quarter 2013, profits for the S&P 500 companies grew to 9.7 % despite the weak economy, with much of that amount driven by cost cutting and reductions in input costs, according to the Wall Street Journal. Figure 5 shows corporate profits after taxes (adjusted for inventory and capital consumption). Despite the steep decline in quarterly net profit in 2008, profits have recovered and surpassed pre-Recession levels.
Corporate Profits After Tax (Adjusted for Inventory and Capital Consumption)
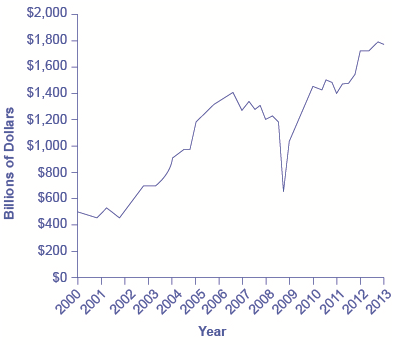
Since 2000, corporate profits after tax have mostly continued to increase each year save for a substantial decrease between 2008 and 2009. (Source: http://research.stlouisfed.org/fred2)
Many firms, from huge companies like General Motors to startup firms writing computer software, do not have the financial resources within the firm to make all the desired investments. These firms need financial capital from outside investors, and they are willing to pay interest for the opportunity to get a rate of return on the investment for that financial capital.
On the other side of the financial capital market, suppliers of financial capital, like households, wish to use their savings in a way that will provide a return. Individuals cannot, however, take the few thousand dollars that they save in any given year, write a letter to General Motors or some other firm, and negotiate to invest their money with that firm. Financial capital markets bridge this gap: that is, they find ways to take the inflow of funds from many separate suppliers of financial capital and transform it into the funds desired by demanders of financial capital. Such financial markets include stocks, bonds, bank loans, and other financial investments.
Our perspective then shifts to consider how these financial investments appear to suppliers of capital such as the households that are saving funds. Households have a range of investment options: bank accounts, certificates of deposit, money market mutual funds, bonds, stocks, stock and bond mutual funds, housing, and even tangible assets like gold. Finally, the chapter investigates two methods for becoming rich: a quick and easy method that does not work very well at all, and a slow, reliable method that can work very well indeed over a lifetime.
Mutual Funds
Buying stocks or bonds issued by a single company is always somewhat risky. An individual firm may find itself buffeted by unfavorable supply and demand conditions or hurt by unlucky or unwise managerial decisions. Thus, a standard recommendation from financial investors is diversification, which means buying stocks or bonds from a wide range of companies. A saver who diversifies is following the old proverb: “Don’t put all your eggs in one basket.” In any broad group of companies, some firms will do better than expected and some will do worse—but the extremes have a tendency to cancel out extreme increases and decreases in value.
Purchasing a diversified group of the stocks or bonds has gotten easier in the Internet age, but it remains something of a task. To simplify the process, companies offer mutual funds, which are organizations that buy a range of stocks or bonds from different companies. The financial investor buys shares of the mutual fund, and then receives a return based on how the fund as a whole performs. In 2012, according to the Investment Company Factbook, about 44% of U.S. households had a financial investment in a mutual fund—including many people who have their retirement savings or pension money invested in this way.
Mutual funds can be focused in certain areas: one mutual fund might invest only in stocks of companies based in Indonesia, or only in bonds issued by large manufacturing companies, or only in stock of biotechnology companies. At the other end of the spectrum, a mutual fund might be quite broad; at the extreme, some mutual funds own a tiny share of every firm in the stock market, and thus the value of the mutual fund will fluctuate with the average of the overall stock market. A mutual fund that seeks only to mimic the overall performance of the market is called an index fund.
Diversification can offset some of the risks of individual stocks rising or falling. Even investors who buy an indexed mutual fund designed to mimic some measure of the broad stock market, like the Standard & Poor’s 500, had better buckle their seat-belts against some ups and downs, like those the stock market experienced in the first decade of the 2000s. In 2008 average U.S. stock funds declined 38%, reducing the wealth of individuals and households. This steep drop in value hit hardest those who were close to retirement and were counting on their stock funds to supplement retirement income.
The bottom line on investing in mutual funds is that the rate of return over time will be high; the risks are also high, but the risks and returns for an individual mutual fund will be lower than those for an individual stock. As with stocks, liquidity is also high provided the mutual fund or stock index fund is readily traded.
How Capital Markets Transform Financial Flows
Financial capital markets have the power to repackage money as it moves from those who supply financial capital to those who demand it. Banks accept checking account deposits and turn them into long-term loans to companies. Individual firms sell shares of stock and issue bonds to raise capital. Firms make and sell an astonishing array of goods and services, but an investor can receive a return on the company’s decisions by buying stock in that company. Stocks and bonds are sold and resold by financial investors to one another. Venture capitalists and angel investors search for promising small companies. Mutual funds combine the stocks and bonds—and thus, indirectly, the products and investments—of many different companies.
In this chapter, we discussed the basic mechanisms of financial markets. The fundamentals of those financial capital markets remain the same: Firms are trying to raise financial capital and households are looking for a desirable combination of rate of return, risk, and liquidity. Financial markets are society’s mechanisms for bringing together these forces of demand and supply.
 Answer the self check questions below to monitor your understanding of the concepts in this section.
Self Check Questions
- Define the terms "saving" and "savings."
- Why is it important for individuals to save?
- What is a financial system?
- Define "certificate of deposit," "financial asset," and "financial intermediary."
- How does the circular flow of funds work?
- Which sector of the economy has the largest savers?
- Which sector of the economy has the largest borrowers?
- List examples of nonbank financial intermediaries.
- Define the term "finance company" and give an example.
- Define the term "life insurance company" and give an example.
- Define the term "mutual fund" and give an example.
- Define the term "pension fund" and give an example.
- Define the term "real estate investment trusts."
| Image | Reference | Attributions |
|
[Figure 1] | Credit: Justin Murphy;OpenStax College;Lumen Learning Source: https://goo.gl/images/S525UD ; https://cnx.org/contents/aWGdK2jw@11.73:jDBBHAWI@5/The-Role-of-Banks#CNX_Econ_C27_002 ; https://courses.lumenlearning.com/wmopen-macroeconomics/chapter/how-banks-create-money/ License: CC BY-NC 3.0 |