
5.5: Frequency and Period of Sinusoidal Functions
- Page ID
- 983
\( \newcommand{\vecs}[1]{\overset { \scriptstyle \rightharpoonup} {\mathbf{#1}} } \)
\( \newcommand{\vecd}[1]{\overset{-\!-\!\rightharpoonup}{\vphantom{a}\smash {#1}}} \)
\( \newcommand{\dsum}{\displaystyle\sum\limits} \)
\( \newcommand{\dint}{\displaystyle\int\limits} \)
\( \newcommand{\dlim}{\displaystyle\lim\limits} \)
\( \newcommand{\id}{\mathrm{id}}\) \( \newcommand{\Span}{\mathrm{span}}\)
( \newcommand{\kernel}{\mathrm{null}\,}\) \( \newcommand{\range}{\mathrm{range}\,}\)
\( \newcommand{\RealPart}{\mathrm{Re}}\) \( \newcommand{\ImaginaryPart}{\mathrm{Im}}\)
\( \newcommand{\Argument}{\mathrm{Arg}}\) \( \newcommand{\norm}[1]{\| #1 \|}\)
\( \newcommand{\inner}[2]{\langle #1, #2 \rangle}\)
\( \newcommand{\Span}{\mathrm{span}}\)
\( \newcommand{\id}{\mathrm{id}}\)
\( \newcommand{\Span}{\mathrm{span}}\)
\( \newcommand{\kernel}{\mathrm{null}\,}\)
\( \newcommand{\range}{\mathrm{range}\,}\)
\( \newcommand{\RealPart}{\mathrm{Re}}\)
\( \newcommand{\ImaginaryPart}{\mathrm{Im}}\)
\( \newcommand{\Argument}{\mathrm{Arg}}\)
\( \newcommand{\norm}[1]{\| #1 \|}\)
\( \newcommand{\inner}[2]{\langle #1, #2 \rangle}\)
\( \newcommand{\Span}{\mathrm{span}}\) \( \newcommand{\AA}{\unicode[.8,0]{x212B}}\)
\( \newcommand{\vectorA}[1]{\vec{#1}} % arrow\)
\( \newcommand{\vectorAt}[1]{\vec{\text{#1}}} % arrow\)
\( \newcommand{\vectorB}[1]{\overset { \scriptstyle \rightharpoonup} {\mathbf{#1}} } \)
\( \newcommand{\vectorC}[1]{\textbf{#1}} \)
\( \newcommand{\vectorD}[1]{\overrightarrow{#1}} \)
\( \newcommand{\vectorDt}[1]{\overrightarrow{\text{#1}}} \)
\( \newcommand{\vectE}[1]{\overset{-\!-\!\rightharpoonup}{\vphantom{a}\smash{\mathbf {#1}}}} \)
\( \newcommand{\vecs}[1]{\overset { \scriptstyle \rightharpoonup} {\mathbf{#1}} } \)
\(\newcommand{\longvect}{\overrightarrow}\)
\( \newcommand{\vecd}[1]{\overset{-\!-\!\rightharpoonup}{\vphantom{a}\smash {#1}}} \)
\(\newcommand{\avec}{\mathbf a}\) \(\newcommand{\bvec}{\mathbf b}\) \(\newcommand{\cvec}{\mathbf c}\) \(\newcommand{\dvec}{\mathbf d}\) \(\newcommand{\dtil}{\widetilde{\mathbf d}}\) \(\newcommand{\evec}{\mathbf e}\) \(\newcommand{\fvec}{\mathbf f}\) \(\newcommand{\nvec}{\mathbf n}\) \(\newcommand{\pvec}{\mathbf p}\) \(\newcommand{\qvec}{\mathbf q}\) \(\newcommand{\svec}{\mathbf s}\) \(\newcommand{\tvec}{\mathbf t}\) \(\newcommand{\uvec}{\mathbf u}\) \(\newcommand{\vvec}{\mathbf v}\) \(\newcommand{\wvec}{\mathbf w}\) \(\newcommand{\xvec}{\mathbf x}\) \(\newcommand{\yvec}{\mathbf y}\) \(\newcommand{\zvec}{\mathbf z}\) \(\newcommand{\rvec}{\mathbf r}\) \(\newcommand{\mvec}{\mathbf m}\) \(\newcommand{\zerovec}{\mathbf 0}\) \(\newcommand{\onevec}{\mathbf 1}\) \(\newcommand{\real}{\mathbb R}\) \(\newcommand{\twovec}[2]{\left[\begin{array}{r}#1 \\ #2 \end{array}\right]}\) \(\newcommand{\ctwovec}[2]{\left[\begin{array}{c}#1 \\ #2 \end{array}\right]}\) \(\newcommand{\threevec}[3]{\left[\begin{array}{r}#1 \\ #2 \\ #3 \end{array}\right]}\) \(\newcommand{\cthreevec}[3]{\left[\begin{array}{c}#1 \\ #2 \\ #3 \end{array}\right]}\) \(\newcommand{\fourvec}[4]{\left[\begin{array}{r}#1 \\ #2 \\ #3 \\ #4 \end{array}\right]}\) \(\newcommand{\cfourvec}[4]{\left[\begin{array}{c}#1 \\ #2 \\ #3 \\ #4 \end{array}\right]}\) \(\newcommand{\fivevec}[5]{\left[\begin{array}{r}#1 \\ #2 \\ #3 \\ #4 \\ #5 \\ \end{array}\right]}\) \(\newcommand{\cfivevec}[5]{\left[\begin{array}{c}#1 \\ #2 \\ #3 \\ #4 \\ #5 \\ \end{array}\right]}\) \(\newcommand{\mattwo}[4]{\left[\begin{array}{rr}#1 \amp #2 \\ #3 \amp #4 \\ \end{array}\right]}\) \(\newcommand{\laspan}[1]{\text{Span}\{#1\}}\) \(\newcommand{\bcal}{\cal B}\) \(\newcommand{\ccal}{\cal C}\) \(\newcommand{\scal}{\cal S}\) \(\newcommand{\wcal}{\cal W}\) \(\newcommand{\ecal}{\cal E}\) \(\newcommand{\coords}[2]{\left\{#1\right\}_{#2}}\) \(\newcommand{\gray}[1]{\color{gray}{#1}}\) \(\newcommand{\lgray}[1]{\color{lightgray}{#1}}\) \(\newcommand{\rank}{\operatorname{rank}}\) \(\newcommand{\row}{\text{Row}}\) \(\newcommand{\col}{\text{Col}}\) \(\renewcommand{\row}{\text{Row}}\) \(\newcommand{\nul}{\text{Nul}}\) \(\newcommand{\var}{\text{Var}}\) \(\newcommand{\corr}{\text{corr}}\) \(\newcommand{\len}[1]{\left|#1\right|}\) \(\newcommand{\bbar}{\overline{\bvec}}\) \(\newcommand{\bhat}{\widehat{\bvec}}\) \(\newcommand{\bperp}{\bvec^\perp}\) \(\newcommand{\xhat}{\widehat{\xvec}}\) \(\newcommand{\vhat}{\widehat{\vvec}}\) \(\newcommand{\uhat}{\widehat{\uvec}}\) \(\newcommand{\what}{\widehat{\wvec}}\) \(\newcommand{\Sighat}{\widehat{\Sigma}}\) \(\newcommand{\lt}{<}\) \(\newcommand{\gt}{>}\) \(\newcommand{\amp}{&}\) \(\definecolor{fillinmathshade}{gray}{0.9}\)The transformation rules about horizontal stretching and shrinking directly apply to sine and cosine graphs. If a sine graph is horizontally stretched by a factor of \(\frac{1}{2}\) that is the same as a horizontal compression by a factor of 2.
How does the equation change when a sine or cosine graph is stretched by a factor of 3?
Period and Frequency of Sinusoidal Functions
The general equation for a sinusoidal function is:
f(x)=±a⋅sin(b(x+c))+d
The \(\pm\) controls the reflection across the \(x\) -axis. The coefficient \(a\) controls the amplitude. The constant \(d\) controls the vertical shift. Here you will see that the coefficient \(b\) controls the horizontal stretch.
Period
Horizontal stretch is measured for sinusoidal functions as their periods. This is why this function family is also called the periodic function family. The period of a sinusoid is the length of a complete cycle. For basic sine and cosine functions, the period is \(2 \pi\). This length can be measured in multiple ways. In word problems and in other tricky circumstances, it may be most useful to measure from peak to peak.
The following three waves have different periods. To rank each wave by period from shortest to longest, look at he distance between each peak.
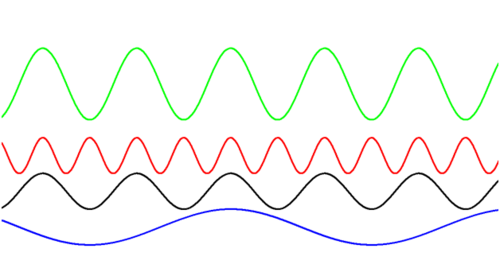
The red wave has the shortest period.
The green and black waves have equal periods. Even though the green wave has greater amplitude than the black wave, they both have the same period.
The blue wave has the longest period.
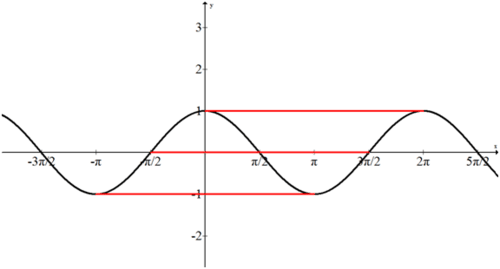
The ability to measure the period of a function in multiple ways allows different equations to model an identical graph. In the image above, the top red line would represent a regular cosine wave. The center red line would represent a regular sine wave with a horizontal shift. The bottom red line would represent a negative cosine wave with a horizontal shift. This flexibility in perspective means that many of the examples, guided practice and practice problems may have multiple solutions. For now, try to always choose the function that has a period starting at \(x=0\).
Frequency
Frequency is a different way of measuring horizontal stretch. For sound, frequency is known as pitch. With sinusoidal functions, frequency is the number of cycles that occur in \(2 \pi\). A shorter period means more cycles can fit in \(2 \pi\) and thus a higher frequency. Period and frequency are inversely related by the equation:
period \(=\frac{2 \pi}{\text { frequency }}\)
The equation of a basic sine function is \(f(x)=\sin x\). In this case \(b\), the frequency, is equal to 1 which means one cycle occurs in \(2 \pi .\) If \(b=\frac{1}{2},\) the period is \(\frac{2 \pi}{\frac{1}{2}}\) which means the period is \(4 \pi\) and the graph is stretched.
Examples
Earlier, you were asked how an equation changes when a sine or cosine graph is stretched by a factor of 3 . If a sine graph is horizontally stretched by a factor of 3 then the general equation has \(b=\frac{1}{3}\). This is because \(b\) is the frequency and counts the number (or fraction) of a period that fits in a normal period of \(2 \pi\). Graphically, the sine wave will make a complete cycle in \(6 \pi\). Similarly, a cosine graph will have \(b=\frac{1}{3}\) and will have a period of \(6 \pi\).
Identify the amplitude, vertical shift, period and frequency of the following function. Then graph the function.
\(f(x)=2 \sin \left(\frac{x}{3}\right)+1\)
\(a=2, b=\frac{1}{3}, d=1\)
The amplitude is 2 , the vertical shift is \(1,\) and the frequency is \(\frac{1}{3}\). The period would be \(\frac{2 \pi}{\frac{1}{3}}\), or \(6\pi\).
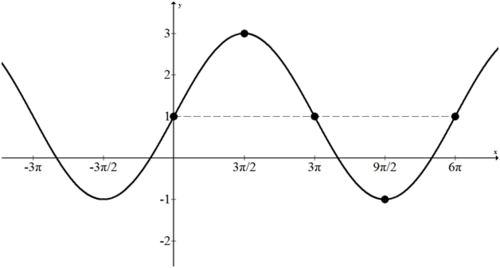
Often the most challenging part of graphing periodic functions is labeling the axes. since the period is \(6 \pi,\) start by drawing the sinusoidal axis shifted appropriately. Then divide the \(6 \pi\) into four parts so that the 5 guiding points of the sine graph can be plotted with the amplitude and reflection in mind. The very last thing to do is to draw and extend the curve.
A measuring stick on a dock measures high tide to be 18 feet and low tide to be 6 feet. It takes about 6 hours for the tide to switch between low and high tides. Determine a graphical and algebraic model for the tides knowing that at \(t=0\) there is a high tide.
Usually the best course of action for word problems is to identify information, plot points, sketch and then finally come up with an equation.
From the given information you can deduce the following points. Notice how the sinusoidal axis can be assumed to be the average of the high and low tides.
\(
\begin{array}{|l|l|}
\hline \text { Time (hours) } & \text { Water level (feet) } \\
\hline 0 & 18 \\
\hline 6 & 6 \\
\hline 12 & 18 \\
\hline 3 & \frac{18+6}{2}=12 \\
\hline 9 & 12 \\
\hline
\end{array}
\)
By plotting those points and filling in the sinusoidal axis you can observe a cosine graph.
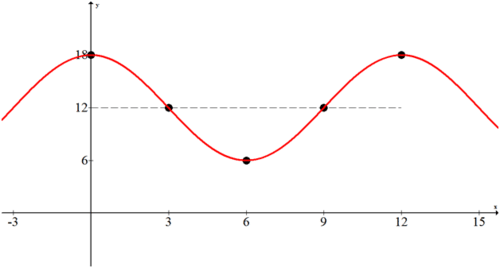
The amplitude is 6 so \(a=6\). There is no vertical reflection. since the period is 12 you can determine the frequency \(b\) :
\(12=\frac{2 \pi}{b} \rightarrow b=\frac{\pi}{6}\)
The vertical shift is 12 so \(d=12\). Thus you have all the pieces to make an algebraic model:
\(f(x)=6 \cdot \cos \left(\frac{\pi}{6} x\right)+12\)
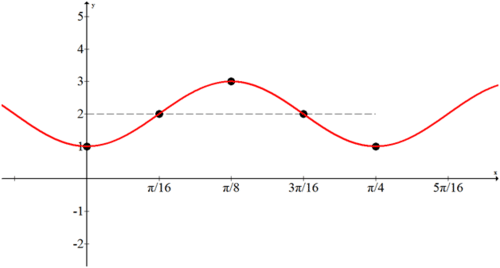
Graph the following function: \(g(x)=-\cos (8 x)+2\)
The labeling is the most important and challenging part of this problem. The amplitude is \(1 .\) The shape is a negative cosine. The vertical shift is \(2 .\) The period is \(\frac{2 \pi}{8}=\frac{\pi}{4}\)
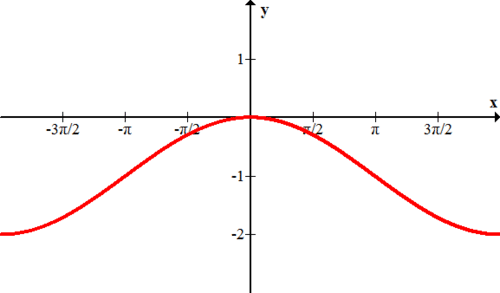
Given the following graph, identify the amplitude, period, and frequency and create an algebraic model.
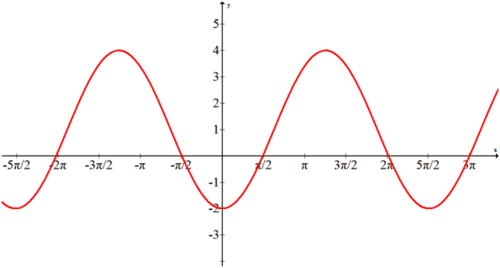
The amplitude is \(3 .\) The shape is a negative cosine. The period is \(\frac{5 \pi}{2}\) which implies that \(b=\frac{4}{5}\). The vertical shift is 1. \(f(x)=-3 \cdot \cos \left(\frac{4}{5} x\right)+1\)
Review
Find the frequency and period of each function below.
1. \(f(x)=\sin (4 x)+1\)
2. \(g(x)=-3 \cos (2 x)\)
3. \(h(x)=\cos \left(\frac{1}{2} x\right)+2\)
4. \(k(x)=-2 \sin \left(\frac{3}{4} x\right)+1\)
5. \(j(x)=4 \cos (3 x)-1\)
Graph each of the following functions.
6. \(f(x)=3 \sin (2 x)+1\)
7. \(g(x)=2.5 \cos (\pi x)-4\)
8. \(h(x)=-\sin (4 x)-3\)
9. \(k(x)=\frac{1}{2} \cos (2 x)\)
10. \(j(x)=-2 \sin \left(\frac{3}{4} x\right)-1\)
Create an algebraic model for each of the following graphs.
11.
12.
13.
14. At time 0 it is high tide and the water at a certain location is 10 feet high. At low tide 6 hours later, the water is 2 feet high. Given that tides can be modeled by sinusoidal functions, find a graph that models this scenario.
15. Find the equation that models the scenario in the previous problem.
...