
2.6.2: Broken-Line Graphs
- Page ID
- 5765
\( \newcommand{\vecs}[1]{\overset { \scriptstyle \rightharpoonup} {\mathbf{#1}} } \)
\( \newcommand{\vecd}[1]{\overset{-\!-\!\rightharpoonup}{\vphantom{a}\smash {#1}}} \)
\( \newcommand{\dsum}{\displaystyle\sum\limits} \)
\( \newcommand{\dint}{\displaystyle\int\limits} \)
\( \newcommand{\dlim}{\displaystyle\lim\limits} \)
\( \newcommand{\id}{\mathrm{id}}\) \( \newcommand{\Span}{\mathrm{span}}\)
( \newcommand{\kernel}{\mathrm{null}\,}\) \( \newcommand{\range}{\mathrm{range}\,}\)
\( \newcommand{\RealPart}{\mathrm{Re}}\) \( \newcommand{\ImaginaryPart}{\mathrm{Im}}\)
\( \newcommand{\Argument}{\mathrm{Arg}}\) \( \newcommand{\norm}[1]{\| #1 \|}\)
\( \newcommand{\inner}[2]{\langle #1, #2 \rangle}\)
\( \newcommand{\Span}{\mathrm{span}}\)
\( \newcommand{\id}{\mathrm{id}}\)
\( \newcommand{\Span}{\mathrm{span}}\)
\( \newcommand{\kernel}{\mathrm{null}\,}\)
\( \newcommand{\range}{\mathrm{range}\,}\)
\( \newcommand{\RealPart}{\mathrm{Re}}\)
\( \newcommand{\ImaginaryPart}{\mathrm{Im}}\)
\( \newcommand{\Argument}{\mathrm{Arg}}\)
\( \newcommand{\norm}[1]{\| #1 \|}\)
\( \newcommand{\inner}[2]{\langle #1, #2 \rangle}\)
\( \newcommand{\Span}{\mathrm{span}}\) \( \newcommand{\AA}{\unicode[.8,0]{x212B}}\)
\( \newcommand{\vectorA}[1]{\vec{#1}} % arrow\)
\( \newcommand{\vectorAt}[1]{\vec{\text{#1}}} % arrow\)
\( \newcommand{\vectorB}[1]{\overset { \scriptstyle \rightharpoonup} {\mathbf{#1}} } \)
\( \newcommand{\vectorC}[1]{\textbf{#1}} \)
\( \newcommand{\vectorD}[1]{\overrightarrow{#1}} \)
\( \newcommand{\vectorDt}[1]{\overrightarrow{\text{#1}}} \)
\( \newcommand{\vectE}[1]{\overset{-\!-\!\rightharpoonup}{\vphantom{a}\smash{\mathbf {#1}}}} \)
\( \newcommand{\vecs}[1]{\overset { \scriptstyle \rightharpoonup} {\mathbf{#1}} } \)
\(\newcommand{\longvect}{\overrightarrow}\)
\( \newcommand{\vecd}[1]{\overset{-\!-\!\rightharpoonup}{\vphantom{a}\smash {#1}}} \)
\(\newcommand{\avec}{\mathbf a}\) \(\newcommand{\bvec}{\mathbf b}\) \(\newcommand{\cvec}{\mathbf c}\) \(\newcommand{\dvec}{\mathbf d}\) \(\newcommand{\dtil}{\widetilde{\mathbf d}}\) \(\newcommand{\evec}{\mathbf e}\) \(\newcommand{\fvec}{\mathbf f}\) \(\newcommand{\nvec}{\mathbf n}\) \(\newcommand{\pvec}{\mathbf p}\) \(\newcommand{\qvec}{\mathbf q}\) \(\newcommand{\svec}{\mathbf s}\) \(\newcommand{\tvec}{\mathbf t}\) \(\newcommand{\uvec}{\mathbf u}\) \(\newcommand{\vvec}{\mathbf v}\) \(\newcommand{\wvec}{\mathbf w}\) \(\newcommand{\xvec}{\mathbf x}\) \(\newcommand{\yvec}{\mathbf y}\) \(\newcommand{\zvec}{\mathbf z}\) \(\newcommand{\rvec}{\mathbf r}\) \(\newcommand{\mvec}{\mathbf m}\) \(\newcommand{\zerovec}{\mathbf 0}\) \(\newcommand{\onevec}{\mathbf 1}\) \(\newcommand{\real}{\mathbb R}\) \(\newcommand{\twovec}[2]{\left[\begin{array}{r}#1 \\ #2 \end{array}\right]}\) \(\newcommand{\ctwovec}[2]{\left[\begin{array}{c}#1 \\ #2 \end{array}\right]}\) \(\newcommand{\threevec}[3]{\left[\begin{array}{r}#1 \\ #2 \\ #3 \end{array}\right]}\) \(\newcommand{\cthreevec}[3]{\left[\begin{array}{c}#1 \\ #2 \\ #3 \end{array}\right]}\) \(\newcommand{\fourvec}[4]{\left[\begin{array}{r}#1 \\ #2 \\ #3 \\ #4 \end{array}\right]}\) \(\newcommand{\cfourvec}[4]{\left[\begin{array}{c}#1 \\ #2 \\ #3 \\ #4 \end{array}\right]}\) \(\newcommand{\fivevec}[5]{\left[\begin{array}{r}#1 \\ #2 \\ #3 \\ #4 \\ #5 \\ \end{array}\right]}\) \(\newcommand{\cfivevec}[5]{\left[\begin{array}{c}#1 \\ #2 \\ #3 \\ #4 \\ #5 \\ \end{array}\right]}\) \(\newcommand{\mattwo}[4]{\left[\begin{array}{rr}#1 \amp #2 \\ #3 \amp #4 \\ \end{array}\right]}\) \(\newcommand{\laspan}[1]{\text{Span}\{#1\}}\) \(\newcommand{\bcal}{\cal B}\) \(\newcommand{\ccal}{\cal C}\) \(\newcommand{\scal}{\cal S}\) \(\newcommand{\wcal}{\cal W}\) \(\newcommand{\ecal}{\cal E}\) \(\newcommand{\coords}[2]{\left\{#1\right\}_{#2}}\) \(\newcommand{\gray}[1]{\color{gray}{#1}}\) \(\newcommand{\lgray}[1]{\color{lightgray}{#1}}\) \(\newcommand{\rank}{\operatorname{rank}}\) \(\newcommand{\row}{\text{Row}}\) \(\newcommand{\col}{\text{Col}}\) \(\renewcommand{\row}{\text{Row}}\) \(\newcommand{\nul}{\text{Nul}}\) \(\newcommand{\var}{\text{Var}}\) \(\newcommand{\corr}{\text{corr}}\) \(\newcommand{\len}[1]{\left|#1\right|}\) \(\newcommand{\bbar}{\overline{\bvec}}\) \(\newcommand{\bhat}{\widehat{\bvec}}\) \(\newcommand{\bperp}{\bvec^\perp}\) \(\newcommand{\xhat}{\widehat{\xvec}}\) \(\newcommand{\vhat}{\widehat{\vvec}}\) \(\newcommand{\uhat}{\widehat{\uvec}}\) \(\newcommand{\what}{\widehat{\wvec}}\) \(\newcommand{\Sighat}{\widehat{\Sigma}}\) \(\newcommand{\lt}{<}\) \(\newcommand{\gt}{>}\) \(\newcommand{\amp}{&}\) \(\definecolor{fillinmathshade}{gray}{0.9}\)Broken Line Graphs
A variation of a line graph is a broken-line graph. This type of line graph is used when it is necessary to show change over time. A line is used to join the values, but the line has no defined slope. However, the points are meaningful, and they all represent an important part of the graph. Usually a broken-line graph is given to you, and you must interpret the given information from the graph.
Interpreting a Broken Line Graph
1. Answer the questions below for the following broken-line graph, which shows the distance, over time, of a bus from the bus depot.
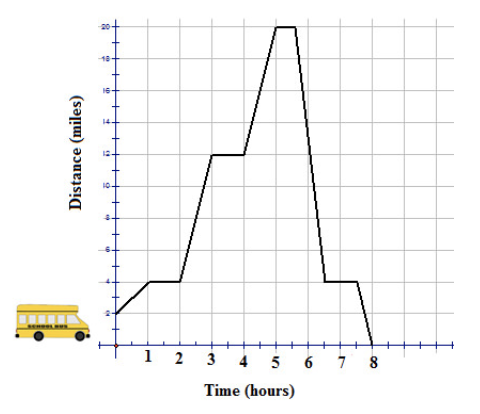
a. What was the fastest speed of the bus?
The fasted speed of the bus was 16 miles per hour.
b. How many times did the bus stop on its trip? (Do not count the beginning and the end of the trip.)
The bus was stopped 4 times.
c. What was the initial distance of the bus from the bus depot?
The bus was initially 2 miles from the bus depot.
d. What was the total distance traveled by the bus?
The total distance traveled by the bus was 38 miles.
2. Sam decides to spend some time with his friend Aaron. He hops on his bike and starts off to Aaron’s house, but on his way, he gets a flat tire and must walk the remaining distance. Once he arrives at Aaron’s house, they repair the flat tire, play some poker, and then Sam returns home. On his way home, Sam decides to stop at the mall to buy a book on how to play poker. The following graph represents Sam’s adventure:
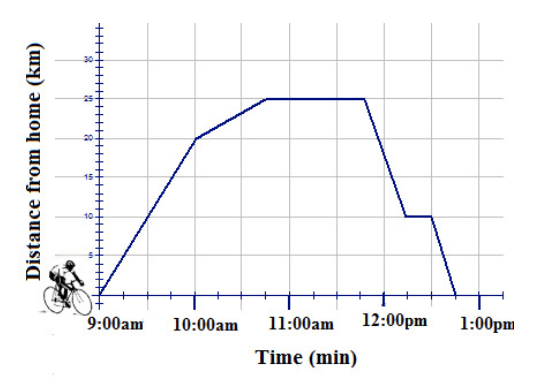
a) How far is it from Sam’s house to Aaron’s house?
It is 25 km from Sam's house to Aaron's house.
b) How far is it from Aaron’s house to the mall?
It is 15 km from Aaron's house to the mall.
c) At what time did Sam have a flat tire?
Sam had a flat tire at 10:00 am.
d) How long did Sam stay at Aaron’s house?
Sam stayed at Aaron's house for 1 hour.
e) At what speed did Sam travel from Aaron’s house to the mall and then from the mall to home?
Sam traveled at a speed of 30 km/h from Aaron's house to the mall and then at a speed of 40 km/h from the mall to home.
3. The following graph is an example of a broken-line graph, and it represents the time of a round-trip journey, driving from home to a popular campground and back.
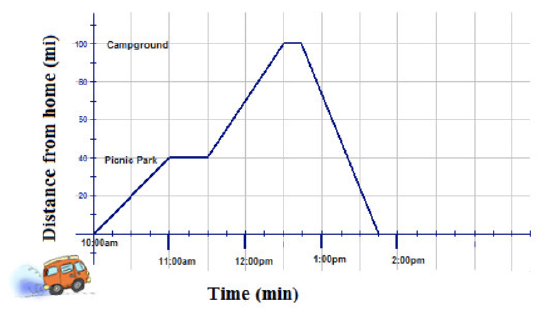
a) How far is it from home to the picnic park?
It is 40 miles from home to the picnic park.
b) How far is it from the picnic park to the campground?
It is 60 miles from the picnic park to the campground.
c) At what 2 places did the car stop?
The car stopped at the picnic park and at the campground.
d) How long was the car stopped at the campground?
The car was stopped at the campground for 15 minutes.
e) When does the car arrive at the picnic park?
The car arrived at the picnic park at 11:00 am.
f) How long did it take for the return trip?
The return trip took 1 hour.
g) What was the speed of the car from home to the picnic park?
The speed of the car from home to the picnic park was 40 mi/h
h) What was the speed of the car from the campground to home?
The speed of the car from the campground to home was 100 mi/h.
Example
Example 1
For the following broken-line graph, write a story to accompany the graph, and provide a detailed description of the events that are occurring.
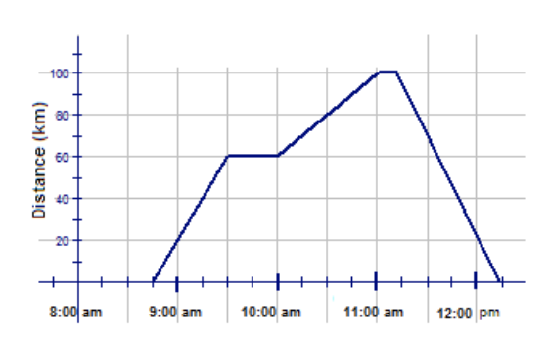
Before we write our story, let's summarize what we know from the graph. We know that the story begins at 8:45 am, because the line touches the x-axis at the third tick mark between 8:00 am and 9:00 am. We also know that from 8:45 am to 9:30 am, a distance of 60 km was traveled. This is because from 8:45 am to the second tick mark between 9:00 and 10:00 am, the line goes from 0 km to 60 km on the y-axis. This means that 60 km was traveled in 45 minutes, so the speed during this time can be calculated as follows:
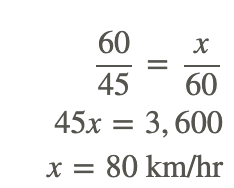
Next, we can see that from 9:30 am to 10:00 am, no distance was traveled, since the line is horizontal in this interval. However, from 10:00 am to 11:00 am, 40 km was traveled, This is because from 10:00 am to 11:00 am, the line goes from 60 km to 100 km on the y-axis, and 100−60=40. Therefore, the speed during this time was 40 km/hr. From 11:00 am to 11:15 am, there was, again, no distance traveled, since the line is horizontal from 11:00 am to the first tick mark between 11:00 am and 12:00 pm. Finally, from 11:15 am to 12:15 pm, 100 km was traveled, since the line goes from 100 km to 0 km on the y-axis from 11:15 am to the first tick mark after 12:00 pm. This means that the speed during this time was 100 km/hr. Also, since the distance is decreasing in this interval, we know that this was a return trip. Because the line touches the x-axis at 12:15 pm, this is the end of the trip.
Now we are ready to write our story. As long as it adheres to what we found above, anything is fine, but here is an example of what we could write:
Deena is going on a shopping trip. From 8:45 am to 9:30 am, she drove her car to a neighboring town 60 km away, traveling at a speed of 80 km/hr. She then decided to stop and have breakfast for 30 minutes before resuming her trip. Traffic was a little heavy for the next hour, so she only managed to go 40 km in this time, traveling at a speed of 40 km/hr. At 11:00 am, she reached the shopping mall that was her destination, but it seemed to be closed. After looking around for 15 minutes, she decided that it was, in fact, closed, so she began her trip home. Traffic was much lighter on the way home, so she covered the entire 100 km non-stop in 1 hour, traveling at a speed of 100 kn/hr. She arrived home at 12:15 pm.
Review
- What name is given to a graph that shows change over time, with points that are joined but have no defined slope?
- linear graph
- broken-line graph
- scatter plot
- line of best fit
Use the broken-line graph below, which represents a bike ride, to answer the following questions.
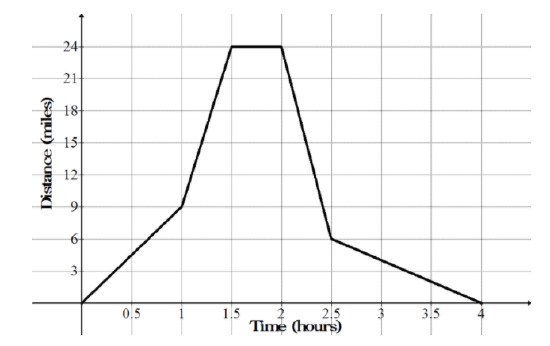
- What was the total distance traveled on the bike ride?
- What was the fastest speed traveled by the bike?
- What was the slowest speed traveled by the bike?
- How long did the bicyclist stop before beginning his or her return trip?
- How long did the return trip take?
Bob is looking for the post office, but he is lost. The broken-like graph below shows his distance from the post office as he wanders about the city. Use the broken-line graph to answer the following questions.
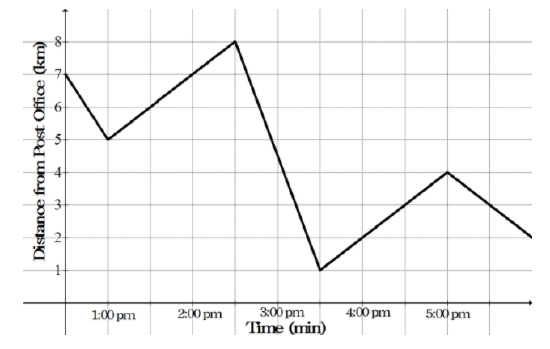
- During what time intervals is Bob getting closer to the post office?
- During what time intervals is Bob getting farther away from the post office?
- What is the total distance traveled by Bob from 12:30 pm to 6:00 pm, which is the duration of time shown by the graph?
- What was Bob's average speed from 12:30 pm to 6:00 pm?
Vocabulary
| Term | Definition |
|---|---|
| broken-line graph | is a graph that is used when it is necessary to show change over time. A line is used to join the values, but the line has no defined slope. |
Additional Resources
PLIX: Play, Learn, Interact, eXplore - Heating Curve of Water
Video: Broken Line Graphs Examples
Activities: Broken-Line Graphs Discussion Questions
Lesson Plans: Broken Line Graphs Lesson Plan
Practice: Broken-Line Graphs
Real World: Broken Line Graphs