
6.2: Empirical Rule
- Page ID
- 5730
\( \newcommand{\vecs}[1]{\overset { \scriptstyle \rightharpoonup} {\mathbf{#1}} } \)
\( \newcommand{\vecd}[1]{\overset{-\!-\!\rightharpoonup}{\vphantom{a}\smash {#1}}} \)
\( \newcommand{\dsum}{\displaystyle\sum\limits} \)
\( \newcommand{\dint}{\displaystyle\int\limits} \)
\( \newcommand{\dlim}{\displaystyle\lim\limits} \)
\( \newcommand{\id}{\mathrm{id}}\) \( \newcommand{\Span}{\mathrm{span}}\)
( \newcommand{\kernel}{\mathrm{null}\,}\) \( \newcommand{\range}{\mathrm{range}\,}\)
\( \newcommand{\RealPart}{\mathrm{Re}}\) \( \newcommand{\ImaginaryPart}{\mathrm{Im}}\)
\( \newcommand{\Argument}{\mathrm{Arg}}\) \( \newcommand{\norm}[1]{\| #1 \|}\)
\( \newcommand{\inner}[2]{\langle #1, #2 \rangle}\)
\( \newcommand{\Span}{\mathrm{span}}\)
\( \newcommand{\id}{\mathrm{id}}\)
\( \newcommand{\Span}{\mathrm{span}}\)
\( \newcommand{\kernel}{\mathrm{null}\,}\)
\( \newcommand{\range}{\mathrm{range}\,}\)
\( \newcommand{\RealPart}{\mathrm{Re}}\)
\( \newcommand{\ImaginaryPart}{\mathrm{Im}}\)
\( \newcommand{\Argument}{\mathrm{Arg}}\)
\( \newcommand{\norm}[1]{\| #1 \|}\)
\( \newcommand{\inner}[2]{\langle #1, #2 \rangle}\)
\( \newcommand{\Span}{\mathrm{span}}\) \( \newcommand{\AA}{\unicode[.8,0]{x212B}}\)
\( \newcommand{\vectorA}[1]{\vec{#1}} % arrow\)
\( \newcommand{\vectorAt}[1]{\vec{\text{#1}}} % arrow\)
\( \newcommand{\vectorB}[1]{\overset { \scriptstyle \rightharpoonup} {\mathbf{#1}} } \)
\( \newcommand{\vectorC}[1]{\textbf{#1}} \)
\( \newcommand{\vectorD}[1]{\overrightarrow{#1}} \)
\( \newcommand{\vectorDt}[1]{\overrightarrow{\text{#1}}} \)
\( \newcommand{\vectE}[1]{\overset{-\!-\!\rightharpoonup}{\vphantom{a}\smash{\mathbf {#1}}}} \)
\( \newcommand{\vecs}[1]{\overset { \scriptstyle \rightharpoonup} {\mathbf{#1}} } \)
\(\newcommand{\longvect}{\overrightarrow}\)
\( \newcommand{\vecd}[1]{\overset{-\!-\!\rightharpoonup}{\vphantom{a}\smash {#1}}} \)
\(\newcommand{\avec}{\mathbf a}\) \(\newcommand{\bvec}{\mathbf b}\) \(\newcommand{\cvec}{\mathbf c}\) \(\newcommand{\dvec}{\mathbf d}\) \(\newcommand{\dtil}{\widetilde{\mathbf d}}\) \(\newcommand{\evec}{\mathbf e}\) \(\newcommand{\fvec}{\mathbf f}\) \(\newcommand{\nvec}{\mathbf n}\) \(\newcommand{\pvec}{\mathbf p}\) \(\newcommand{\qvec}{\mathbf q}\) \(\newcommand{\svec}{\mathbf s}\) \(\newcommand{\tvec}{\mathbf t}\) \(\newcommand{\uvec}{\mathbf u}\) \(\newcommand{\vvec}{\mathbf v}\) \(\newcommand{\wvec}{\mathbf w}\) \(\newcommand{\xvec}{\mathbf x}\) \(\newcommand{\yvec}{\mathbf y}\) \(\newcommand{\zvec}{\mathbf z}\) \(\newcommand{\rvec}{\mathbf r}\) \(\newcommand{\mvec}{\mathbf m}\) \(\newcommand{\zerovec}{\mathbf 0}\) \(\newcommand{\onevec}{\mathbf 1}\) \(\newcommand{\real}{\mathbb R}\) \(\newcommand{\twovec}[2]{\left[\begin{array}{r}#1 \\ #2 \end{array}\right]}\) \(\newcommand{\ctwovec}[2]{\left[\begin{array}{c}#1 \\ #2 \end{array}\right]}\) \(\newcommand{\threevec}[3]{\left[\begin{array}{r}#1 \\ #2 \\ #3 \end{array}\right]}\) \(\newcommand{\cthreevec}[3]{\left[\begin{array}{c}#1 \\ #2 \\ #3 \end{array}\right]}\) \(\newcommand{\fourvec}[4]{\left[\begin{array}{r}#1 \\ #2 \\ #3 \\ #4 \end{array}\right]}\) \(\newcommand{\cfourvec}[4]{\left[\begin{array}{c}#1 \\ #2 \\ #3 \\ #4 \end{array}\right]}\) \(\newcommand{\fivevec}[5]{\left[\begin{array}{r}#1 \\ #2 \\ #3 \\ #4 \\ #5 \\ \end{array}\right]}\) \(\newcommand{\cfivevec}[5]{\left[\begin{array}{c}#1 \\ #2 \\ #3 \\ #4 \\ #5 \\ \end{array}\right]}\) \(\newcommand{\mattwo}[4]{\left[\begin{array}{rr}#1 \amp #2 \\ #3 \amp #4 \\ \end{array}\right]}\) \(\newcommand{\laspan}[1]{\text{Span}\{#1\}}\) \(\newcommand{\bcal}{\cal B}\) \(\newcommand{\ccal}{\cal C}\) \(\newcommand{\scal}{\cal S}\) \(\newcommand{\wcal}{\cal W}\) \(\newcommand{\ecal}{\cal E}\) \(\newcommand{\coords}[2]{\left\{#1\right\}_{#2}}\) \(\newcommand{\gray}[1]{\color{gray}{#1}}\) \(\newcommand{\lgray}[1]{\color{lightgray}{#1}}\) \(\newcommand{\rank}{\operatorname{rank}}\) \(\newcommand{\row}{\text{Row}}\) \(\newcommand{\col}{\text{Col}}\) \(\renewcommand{\row}{\text{Row}}\) \(\newcommand{\nul}{\text{Nul}}\) \(\newcommand{\var}{\text{Var}}\) \(\newcommand{\corr}{\text{corr}}\) \(\newcommand{\len}[1]{\left|#1\right|}\) \(\newcommand{\bbar}{\overline{\bvec}}\) \(\newcommand{\bhat}{\widehat{\bvec}}\) \(\newcommand{\bperp}{\bvec^\perp}\) \(\newcommand{\xhat}{\widehat{\xvec}}\) \(\newcommand{\vhat}{\widehat{\vvec}}\) \(\newcommand{\uhat}{\widehat{\uvec}}\) \(\newcommand{\what}{\widehat{\wvec}}\) \(\newcommand{\Sighat}{\widehat{\Sigma}}\) \(\newcommand{\lt}{<}\) \(\newcommand{\gt}{>}\) \(\newcommand{\amp}{&}\) \(\definecolor{fillinmathshade}{gray}{0.9}\)The Empirical Rule
You have already learned that 68% of the data in a normal distribution lies within 1 standard deviation of the mean, 95% of the data lies within 2 standard deviations of the mean, and 99.7% of the data lies within 3 standard deviations of the mean. This is referred to as the Empirical Rule, which is also known as the 68-95-99.7 Rule. To accommodate the percentages given by the Empirical Rule, there are defined values in each of the regions to the left and to the right of the mean.
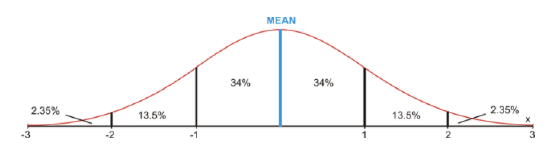
These percentages are used to answer real-world problems when both the mean and the standard deviation of a data set are known. Also keep in mind that since 99.7% of the data in a normal distribution is within 3 standard deviations of the mean, 1−99.7%=0.3% of the data does not fall within 3 standard deviations of the mean. This means that 0.3%/2=0.15% of the data is beyond 3 standard deviations on either end of the normal distribution curve. This is not shown in the figure above.
Real-World Application: Lifetime of Light Bulbs
The lifetimes of a certain type of light bulb are normally distributed. The mean life is 400 hours, and the standard deviation is 75 hours. For a group of 5,000 light bulbs, how many are expected to last each of the following times?
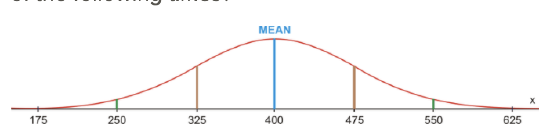
a) between 325 hours and 475 hours
68% of the light bulbs are expected to last between 325 hours and 475 hours. This means that 5,000×0.68=3,400 light bulbs are expected to last between 325 and 475 hours.
b) more than 250 hours
95%+2.35%+0.15%=97.5% of the light bulbs are expected to last more than 250 hours. This means that 5,000×0.975=4,875 of the light bulbs are expected to last more than 250 hours.
c) less than 250 hours
Only 2.35%+0.15%=2.5% of the light bulbs are expected to last less than 250 hours. This means that 5,000×0.025=125 of the light bulbs are expected to last less than 250 hours.
Real-World Application: Bags of Chips
A bag of chips has a mean mass of 70 g, with a standard deviation of 3 g. Assuming a normal distribution, create a normal curve, including all necessary values.
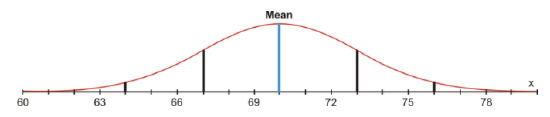
a) If 1,250 bags of chips are processed each day, how many bags will have a mass between 67 g and 73 g?
Between 67 g and 73 g lies 68% of the data. If 1,250 bags of chips are processed, 1,250×0.68=850 bags will have a mass between 67 g and 73 g.
b) What percentage of the bags of chips will have a mass greater than 64 g?
95%+2.35%+0.15%=97.5% of the bags of chips will have a mass greater than 64 grams.
Real-World Application: Half Marathon
The finishing times for people completing a half marathon in 2010 were normally distributed, with a mean of 130 minutes and a standard deviation of 20 minutes. If 1,400,000 people completed a half marathon in 2010, how many people had finishing times between each of the following pairs of times?
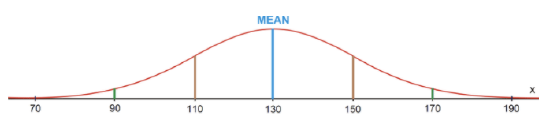
a) 90 minutes and 150 minutes
Between 90 minutes and 150 minutes lies 13.5%+68%=81.5% of the data. This means that 1,400,000×0.815=1,141,000 of the people who completed a half marathon in 2010 had a time between 90 minutes and 150 minutes.
b) 110 minutes and 130 minutes
Between 110 minutes and 130 minutes lies 34% of the data. This means that 1,400,000×0.34=476,000 of the people who completed a half marathon in 2010 had a time between 110 minutes and 130 minutes.
c) 130 minutes and 190 minutes
Between 130 minutes and 190 minutes lies 34%+13.5%+2.35%=49.85% of the data. This means that 1,400,000×0.4985=697,900 of the people who completed a half marathon in 2010 had a time between 130 minutes and 190 minutes.
Points to Consider
- Is the normal distribution curve the only way to represent data?
- The normal distribution curve shows the spread of the data, but it does not show the actual data values. Do other representations of data show the actual data values?
Example
Example 1
Sudoku is a very popular logic game of number combinations. It originated in the late 1800's by the French press, Le Siècle. The average times (in minutes) it takes those in a senior math class to complete a Sudoku puzzle are normally distributed and are found below. Draw a normal distribution curve to represent this data. Determine what time a student must complete a Sudoku puzzle in to be in the top 2.5%.
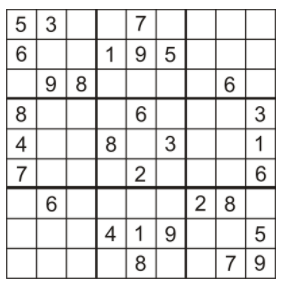
20 15 21 24 7 19 10 17 15 22 31 19 20 21 21 9 12 26 24 28 19 16 24 11 17 31 25 13 16 18 22 32 9 15 19 27 14 25 32 29
You can use the data from the 1-Var Stats calculation to draw the normal distribution curve:
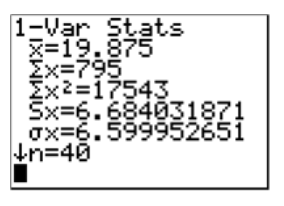
According to the data, the mean of the times is approximately 19.9 minutes, and the standard deviation is approximately 6.6 minutes. Therefore, the normal distribution curve can be drawn as follows:
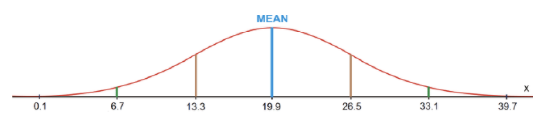
Since 2.35%+0.15%=2.5% of the times are below 6.7 minutes, a student must complete a Sudoku puzzle in 6.7 minutes to be in the top 2.5%.
Review
- What percentage of the data in a normal distribution is between 1 standard deviation below the mean and 2 standard deviations above the mean?
- What percentage of the data in a normal distribution is between 3 standard deviations below the mean and 1 standard deviation above the mean?
- What percentage of the data in a normal distribution is more than 2 standard deviations above the mean?
- What percentage of the data in a normal distribution is between 2 standard deviations below the mean and 3 standard deviations above the mean?
- What percentage of the data in a normal distribution is between 3 standard deviations below the mean and the mean?
- What percentage of the data in a normal distribution is more than 1 standard deviation above the mean?
- What percentage of the data in a normal distribution is between the mean and 2 standard deviations above the mean?
- 200 senior high students were asked how long they had to wait in the cafeteria line for lunch. Their responses were found to be normally distributed, with a mean of 15 minutes and a standard deviation of 3.5 minutes. (a) How many students would you expect to wait more than 11.5 minutes? (b) How many students would you expect to wait more than 18.5 minutes? (c) How many students would you expect to wait between 11.5 and 18.5 minutes?
- 350 babies were born at Neo Hospital in the past 6 months. The average weight for the babies was found to be 6.8 lbs, with a standard deviation of 0.5 lbs. (a) How many babies would you expect to weigh more than 7.3 lbs? (b) How many babies would you expect to weigh more than 7.8 lbs? (c) How many babies would you expect to weigh between 6.3 and 7.8 lbs?
- Sheldon has planted seedlings in his garden in the back yard. After 30 days, he measures the heights of the seedlings to determine how much they have grown. The differences in heights can be seen in the table below. The heights are measured in inches. Draw a normal distribution curve to represent the data. Determine what the range of the differences in heights of the seedlings is for the middle 68% of the data.

10 3 8 4 7 12 8 5 4 9 3 8 6 10 7 10 11 8 12 9 10 7 8 11
Vocabulary
| Term | Definition |
|---|---|
| Empirical Rule | The Empirical Rule is also known as the 68-95-99.7 Rule. When 68% of the data values would be located within 1 standard deviation of the mean, 95% of the data values would be located within 2 standard deviations of the mean, and 99.7% of the data values would be located within 3 standard deviations of the mean, statisticians refer to this as the 68-95-99.7 Rule. |
| 68-95-99.7 Rule | When 68% of the data values would be located within 1 standard deviation of the mean, 95% of the data values would be located within 2 standard deviations of the mean, and 99.7% of the data values would be located within 3 standard deviations of the mean, statisticians refer to this as the 68-95-99.7 Rule. |
| bell curve | A normal distribution curve is also known as a bell curve. |
| normal distributed | If data is normally distributed, the data set creates a symmetric histogram that looks like a bell. |
Additional Resources
PLIX: Play, Learn, Interact, eXplore - The FDA and Food Safety
Video: Normal Distributions and the Empirical Rule
Activities: Empirical Rule Discussion Questions
Study Aids: Normal Distribution Study Guide
Lesson Plans: Calculating the Standard Deviation and Normal Distribution
Practice: Empirical Rule
Real World: Normal Distribution