
6.3: Properties of a Normal Distribution
- Page ID
- 5731
\( \newcommand{\vecs}[1]{\overset { \scriptstyle \rightharpoonup} {\mathbf{#1}} } \)
\( \newcommand{\vecd}[1]{\overset{-\!-\!\rightharpoonup}{\vphantom{a}\smash {#1}}} \)
\( \newcommand{\id}{\mathrm{id}}\) \( \newcommand{\Span}{\mathrm{span}}\)
( \newcommand{\kernel}{\mathrm{null}\,}\) \( \newcommand{\range}{\mathrm{range}\,}\)
\( \newcommand{\RealPart}{\mathrm{Re}}\) \( \newcommand{\ImaginaryPart}{\mathrm{Im}}\)
\( \newcommand{\Argument}{\mathrm{Arg}}\) \( \newcommand{\norm}[1]{\| #1 \|}\)
\( \newcommand{\inner}[2]{\langle #1, #2 \rangle}\)
\( \newcommand{\Span}{\mathrm{span}}\)
\( \newcommand{\id}{\mathrm{id}}\)
\( \newcommand{\Span}{\mathrm{span}}\)
\( \newcommand{\kernel}{\mathrm{null}\,}\)
\( \newcommand{\range}{\mathrm{range}\,}\)
\( \newcommand{\RealPart}{\mathrm{Re}}\)
\( \newcommand{\ImaginaryPart}{\mathrm{Im}}\)
\( \newcommand{\Argument}{\mathrm{Arg}}\)
\( \newcommand{\norm}[1]{\| #1 \|}\)
\( \newcommand{\inner}[2]{\langle #1, #2 \rangle}\)
\( \newcommand{\Span}{\mathrm{span}}\) \( \newcommand{\AA}{\unicode[.8,0]{x212B}}\)
\( \newcommand{\vectorA}[1]{\vec{#1}} % arrow\)
\( \newcommand{\vectorAt}[1]{\vec{\text{#1}}} % arrow\)
\( \newcommand{\vectorB}[1]{\overset { \scriptstyle \rightharpoonup} {\mathbf{#1}} } \)
\( \newcommand{\vectorC}[1]{\textbf{#1}} \)
\( \newcommand{\vectorD}[1]{\overrightarrow{#1}} \)
\( \newcommand{\vectorDt}[1]{\overrightarrow{\text{#1}}} \)
\( \newcommand{\vectE}[1]{\overset{-\!-\!\rightharpoonup}{\vphantom{a}\smash{\mathbf {#1}}}} \)
\( \newcommand{\vecs}[1]{\overset { \scriptstyle \rightharpoonup} {\mathbf{#1}} } \)
\( \newcommand{\vecd}[1]{\overset{-\!-\!\rightharpoonup}{\vphantom{a}\smash {#1}}} \)
\(\newcommand{\avec}{\mathbf a}\) \(\newcommand{\bvec}{\mathbf b}\) \(\newcommand{\cvec}{\mathbf c}\) \(\newcommand{\dvec}{\mathbf d}\) \(\newcommand{\dtil}{\widetilde{\mathbf d}}\) \(\newcommand{\evec}{\mathbf e}\) \(\newcommand{\fvec}{\mathbf f}\) \(\newcommand{\nvec}{\mathbf n}\) \(\newcommand{\pvec}{\mathbf p}\) \(\newcommand{\qvec}{\mathbf q}\) \(\newcommand{\svec}{\mathbf s}\) \(\newcommand{\tvec}{\mathbf t}\) \(\newcommand{\uvec}{\mathbf u}\) \(\newcommand{\vvec}{\mathbf v}\) \(\newcommand{\wvec}{\mathbf w}\) \(\newcommand{\xvec}{\mathbf x}\) \(\newcommand{\yvec}{\mathbf y}\) \(\newcommand{\zvec}{\mathbf z}\) \(\newcommand{\rvec}{\mathbf r}\) \(\newcommand{\mvec}{\mathbf m}\) \(\newcommand{\zerovec}{\mathbf 0}\) \(\newcommand{\onevec}{\mathbf 1}\) \(\newcommand{\real}{\mathbb R}\) \(\newcommand{\twovec}[2]{\left[\begin{array}{r}#1 \\ #2 \end{array}\right]}\) \(\newcommand{\ctwovec}[2]{\left[\begin{array}{c}#1 \\ #2 \end{array}\right]}\) \(\newcommand{\threevec}[3]{\left[\begin{array}{r}#1 \\ #2 \\ #3 \end{array}\right]}\) \(\newcommand{\cthreevec}[3]{\left[\begin{array}{c}#1 \\ #2 \\ #3 \end{array}\right]}\) \(\newcommand{\fourvec}[4]{\left[\begin{array}{r}#1 \\ #2 \\ #3 \\ #4 \end{array}\right]}\) \(\newcommand{\cfourvec}[4]{\left[\begin{array}{c}#1 \\ #2 \\ #3 \\ #4 \end{array}\right]}\) \(\newcommand{\fivevec}[5]{\left[\begin{array}{r}#1 \\ #2 \\ #3 \\ #4 \\ #5 \\ \end{array}\right]}\) \(\newcommand{\cfivevec}[5]{\left[\begin{array}{c}#1 \\ #2 \\ #3 \\ #4 \\ #5 \\ \end{array}\right]}\) \(\newcommand{\mattwo}[4]{\left[\begin{array}{rr}#1 \amp #2 \\ #3 \amp #4 \\ \end{array}\right]}\) \(\newcommand{\laspan}[1]{\text{Span}\{#1\}}\) \(\newcommand{\bcal}{\cal B}\) \(\newcommand{\ccal}{\cal C}\) \(\newcommand{\scal}{\cal S}\) \(\newcommand{\wcal}{\cal W}\) \(\newcommand{\ecal}{\cal E}\) \(\newcommand{\coords}[2]{\left\{#1\right\}_{#2}}\) \(\newcommand{\gray}[1]{\color{gray}{#1}}\) \(\newcommand{\lgray}[1]{\color{lightgray}{#1}}\) \(\newcommand{\rank}{\operatorname{rank}}\) \(\newcommand{\row}{\text{Row}}\) \(\newcommand{\col}{\text{Col}}\) \(\renewcommand{\row}{\text{Row}}\) \(\newcommand{\nul}{\text{Nul}}\) \(\newcommand{\var}{\text{Var}}\) \(\newcommand{\corr}{\text{corr}}\) \(\newcommand{\len}[1]{\left|#1\right|}\) \(\newcommand{\bbar}{\overline{\bvec}}\) \(\newcommand{\bhat}{\widehat{\bvec}}\) \(\newcommand{\bperp}{\bvec^\perp}\) \(\newcommand{\xhat}{\widehat{\xvec}}\) \(\newcommand{\vhat}{\widehat{\vvec}}\) \(\newcommand{\uhat}{\widehat{\uvec}}\) \(\newcommand{\what}{\widehat{\wvec}}\) \(\newcommand{\Sighat}{\widehat{\Sigma}}\) \(\newcommand{\lt}{<}\) \(\newcommand{\gt}{>}\) \(\newcommand{\amp}{&}\) \(\definecolor{fillinmathshade}{gray}{0.9}\)Z-Scores
Using the Empirical Rule can give you a good idea of the probability of occurrence of a value that happens to be exactly one, two or three to either side of the mean, but how do you compare the probabilities of values that are in between standard deviations?
Z-Scores
Z-scores are related to the Empirical Rule from the standpoint of being a method of evaluating how extreme a particular value is in a given set. You can think of a z-score as the number of standard deviations there are between a given value and the mean of the set. While the Empirical Rule allows you to associate the first three standard deviations with the percentage of data that each SD includes, the z-score allows you to state (as accurately as you like), just how many SD’s a given value is above or below the mean.
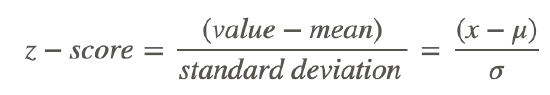
Conceptually, the z-score calculation is just what you might expect, given that you are calculating the number of SD’s between a value and the mean. You calculate the z-score by first calculating the difference between your value and the mean, and then dividing that amount by the standard deviation of the set. The formula looks like this:
In this lesson, we will practice calculating the z-score for various values. In the next lesson, we will learn how to associate the z-score of a value with the probability that the value will occur.
Finding the Z-Score
1. What is the z-score of a value of 27, given a set mean of 24, and a standard deviation of 2?
To find the z-score we need to divide the difference between the value, 27, and the mean, 24, by the standard deviation of the set, 2.
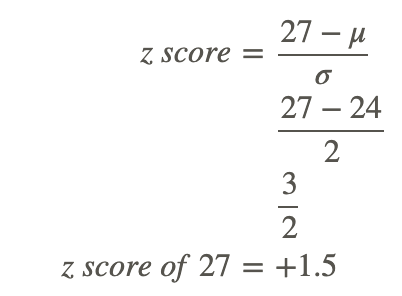
This indicates that 27 is 1.5 standard deviations above the mean.
2. What is the z-score of a value of 104.5, in a set with μ=125 and σ=6.2?
Find the difference between the given value and the mean, then divide it by the standard deviation.
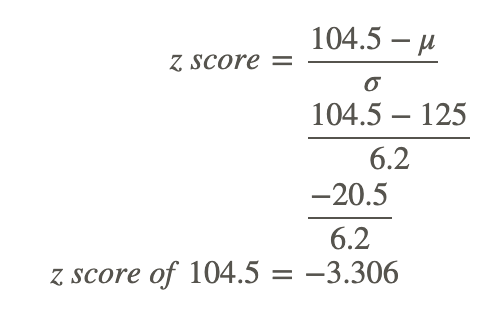
Note that the z-score is negative, since the measured value, 104.5, is less than (below) the mean, 125.
Finding the Value Represented by a Z-Score
Find the value represented by a z-score of 2.403, given μ=63 and σ=4.25.

CK-12 Foundation, Larame Spence - CK-12 Foundation
This one requires that we solve for a missing value rather than for a missing z-score, so we just need to fill in our formula with what we know and solve for the missing value:
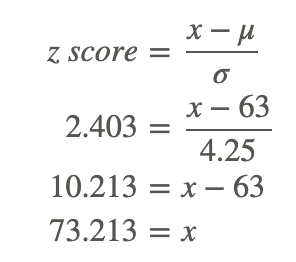
73.213 has a z-score of 2.403
Earlier Problem Revisited
Using the Empirical Rule can give you a good idea of the probability of occurrence of a value that happens to be right on one of the first three standard deviations to either side of the mean, but how do you compare the probabilities of values that are in between standard deviations?
The z-score of a value is the count of the number of standard deviations between the value and the mean of the set. You can find it by subtracting the value from the mean, and dividing the result by the standard deviation.
Examples

Simon - pixabay.com/en/touring-skis-ski-touring-binding-262028/?oq=skis
Example 1
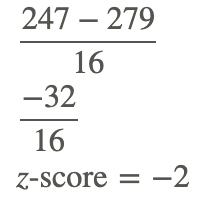
What is the z-score of the price of a pair of skis that cost $247, if the mean ski price is $279, with a standard deviation of $16?
Find first the difference between the measured value and the mean, then divide that difference by the standard deviation:
Example 2
What is the z-score of a 5-scoop ice cream cone if the mean number of scoops is 3, with a standard deviation of 1 scoop?
This one is easy: The difference between 5 scoops and 3 scoops is +2, and we divide that by the standard deviation of 1, so the z-score is +2
Example 3
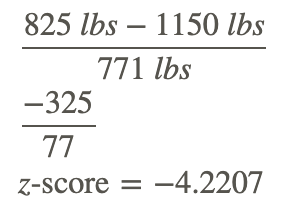
What is the z-score of the weight of a cow that tips the scales at 825 lbs, if the mean weight for cows of her type is 1150 lbs, with a standard deviation of 77 lbs?
First find the difference between the measured value and the mean, then divide that difference by the standard deviation:
Example 4
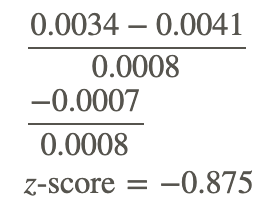
What is the z-score of a measured value of 0.0034, given μ=0.0041 and σ=0.0008?
First find the difference between the measured value and the mean, then divide that difference by the standard deviation:
Review
- Given a distribution with a mean of 70 and standard deviation of 62, find a value with a z-score of -1.82.
- What does a z-score of 3.4 mean?
- Given a distribution with a mean of 60 and standard deviation of 98, find the z-score of 120.76.
- Given a distribution with a mean of 60 and standard deviation of 21, find a value with a z-score of 2.19.
- Find the z-score of 187.37, given a distribution with a mean of 185 and standard deviation of 1.
- What does a z-score of -3.8 mean?
- Find the z-score of 125.18, given a distribution with a mean of 101 and standard deviation of 62.
- Given a distribution with a mean of 117 and standard deviation of 42, find a value with a z-score of -0.94.
- Given a distribution with a mean of 126 and standard deviation of 100, find a value with a z-score of -0.75.
- Find the z-score of 264.16, given μ=188 and σ=64.
- Find a value with a z-score of -0.2, given μ=145 and σ=56.
- Find the z-score of 89.79 given μ=10 and σ=79.
Vocabulary
| Term | Definition |
|---|---|
| continuous random variable | A continuous random variable is a random variable that can take on all values in an interval. |
| density curve | A density curve is an idealized representation of a distribution in which the area under the curve is defined as 1, or in terms of percentages, a probability of 100%. |
| discrete random variables | Discrete random variables represent the number of distinct values that can be counted of an event. |
| empirical rule | The empirical rule states that for data that is normally distributed, approximately 68% of the data will fall within one standard deviation of the mean, approximately 95% of the data will fall within two standard deviations of the mean, and approximately 99.7% of the data will fall within three standard deviations of the mean. |
| inflection point | An inflection point is a point in the domain where concavity changes from positive to negative or negative to positive. |
| Normal Curve | The normal curve is the curve that defines the probability density graph for a normally distributed variable. |
| normal density curve | A normal density curve is a density curve for a normal distribution. |
| probability density function | A function f(x) is called a probability density function if f(x)≥0 for all x, the area under the graph of f(x) over all real numbers is exactly 1, and the probability that x is in the interval [a, b] is P(a≤x≤b)=∫abf(x)dx. |
| standard deviation | The square root of the variance is the standard deviation. Standard deviation is one way to measure the spread of a set of data. |
| variance | A measure of the spread of the data set equal to the mean of the squared variations of each data value from the mean of the data set. |
| z-score | The z -score of a value is the number of standard deviations between the value and the mean of the set. |
| z-score table | A z-score table associates the various common z-scores between 0 and 3.99 with the decimal probability of being less than or equal to that z-score. |
Additional Resources
PLIX: Play, Learn, Interact, eXplore - The FDA and Food Safety
Video: Spread of a Normal Distribution Principles
Activities: Standard Deviation of a Normal Distribution Questions
Study Aids: Normal Distribution Study Guide
Practice: Properties of a Normal Distribution
Real World: Normal Distribution