6.4: Using Tables of the Normal Distribution
- Page ID
- 5732
\( \newcommand{\vecs}[1]{\overset { \scriptstyle \rightharpoonup} {\mathbf{#1}} } \)
\( \newcommand{\vecd}[1]{\overset{-\!-\!\rightharpoonup}{\vphantom{a}\smash {#1}}} \)
\( \newcommand{\id}{\mathrm{id}}\) \( \newcommand{\Span}{\mathrm{span}}\)
( \newcommand{\kernel}{\mathrm{null}\,}\) \( \newcommand{\range}{\mathrm{range}\,}\)
\( \newcommand{\RealPart}{\mathrm{Re}}\) \( \newcommand{\ImaginaryPart}{\mathrm{Im}}\)
\( \newcommand{\Argument}{\mathrm{Arg}}\) \( \newcommand{\norm}[1]{\| #1 \|}\)
\( \newcommand{\inner}[2]{\langle #1, #2 \rangle}\)
\( \newcommand{\Span}{\mathrm{span}}\)
\( \newcommand{\id}{\mathrm{id}}\)
\( \newcommand{\Span}{\mathrm{span}}\)
\( \newcommand{\kernel}{\mathrm{null}\,}\)
\( \newcommand{\range}{\mathrm{range}\,}\)
\( \newcommand{\RealPart}{\mathrm{Re}}\)
\( \newcommand{\ImaginaryPart}{\mathrm{Im}}\)
\( \newcommand{\Argument}{\mathrm{Arg}}\)
\( \newcommand{\norm}[1]{\| #1 \|}\)
\( \newcommand{\inner}[2]{\langle #1, #2 \rangle}\)
\( \newcommand{\Span}{\mathrm{span}}\) \( \newcommand{\AA}{\unicode[.8,0]{x212B}}\)
\( \newcommand{\vectorA}[1]{\vec{#1}} % arrow\)
\( \newcommand{\vectorAt}[1]{\vec{\text{#1}}} % arrow\)
\( \newcommand{\vectorB}[1]{\overset { \scriptstyle \rightharpoonup} {\mathbf{#1}} } \)
\( \newcommand{\vectorC}[1]{\textbf{#1}} \)
\( \newcommand{\vectorD}[1]{\overrightarrow{#1}} \)
\( \newcommand{\vectorDt}[1]{\overrightarrow{\text{#1}}} \)
\( \newcommand{\vectE}[1]{\overset{-\!-\!\rightharpoonup}{\vphantom{a}\smash{\mathbf {#1}}}} \)
\( \newcommand{\vecs}[1]{\overset { \scriptstyle \rightharpoonup} {\mathbf{#1}} } \)
\( \newcommand{\vecd}[1]{\overset{-\!-\!\rightharpoonup}{\vphantom{a}\smash {#1}}} \)
\(\newcommand{\avec}{\mathbf a}\) \(\newcommand{\bvec}{\mathbf b}\) \(\newcommand{\cvec}{\mathbf c}\) \(\newcommand{\dvec}{\mathbf d}\) \(\newcommand{\dtil}{\widetilde{\mathbf d}}\) \(\newcommand{\evec}{\mathbf e}\) \(\newcommand{\fvec}{\mathbf f}\) \(\newcommand{\nvec}{\mathbf n}\) \(\newcommand{\pvec}{\mathbf p}\) \(\newcommand{\qvec}{\mathbf q}\) \(\newcommand{\svec}{\mathbf s}\) \(\newcommand{\tvec}{\mathbf t}\) \(\newcommand{\uvec}{\mathbf u}\) \(\newcommand{\vvec}{\mathbf v}\) \(\newcommand{\wvec}{\mathbf w}\) \(\newcommand{\xvec}{\mathbf x}\) \(\newcommand{\yvec}{\mathbf y}\) \(\newcommand{\zvec}{\mathbf z}\) \(\newcommand{\rvec}{\mathbf r}\) \(\newcommand{\mvec}{\mathbf m}\) \(\newcommand{\zerovec}{\mathbf 0}\) \(\newcommand{\onevec}{\mathbf 1}\) \(\newcommand{\real}{\mathbb R}\) \(\newcommand{\twovec}[2]{\left[\begin{array}{r}#1 \\ #2 \end{array}\right]}\) \(\newcommand{\ctwovec}[2]{\left[\begin{array}{c}#1 \\ #2 \end{array}\right]}\) \(\newcommand{\threevec}[3]{\left[\begin{array}{r}#1 \\ #2 \\ #3 \end{array}\right]}\) \(\newcommand{\cthreevec}[3]{\left[\begin{array}{c}#1 \\ #2 \\ #3 \end{array}\right]}\) \(\newcommand{\fourvec}[4]{\left[\begin{array}{r}#1 \\ #2 \\ #3 \\ #4 \end{array}\right]}\) \(\newcommand{\cfourvec}[4]{\left[\begin{array}{c}#1 \\ #2 \\ #3 \\ #4 \end{array}\right]}\) \(\newcommand{\fivevec}[5]{\left[\begin{array}{r}#1 \\ #2 \\ #3 \\ #4 \\ #5 \\ \end{array}\right]}\) \(\newcommand{\cfivevec}[5]{\left[\begin{array}{c}#1 \\ #2 \\ #3 \\ #4 \\ #5 \\ \end{array}\right]}\) \(\newcommand{\mattwo}[4]{\left[\begin{array}{rr}#1 \amp #2 \\ #3 \amp #4 \\ \end{array}\right]}\) \(\newcommand{\laspan}[1]{\text{Span}\{#1\}}\) \(\newcommand{\bcal}{\cal B}\) \(\newcommand{\ccal}{\cal C}\) \(\newcommand{\scal}{\cal S}\) \(\newcommand{\wcal}{\cal W}\) \(\newcommand{\ecal}{\cal E}\) \(\newcommand{\coords}[2]{\left\{#1\right\}_{#2}}\) \(\newcommand{\gray}[1]{\color{gray}{#1}}\) \(\newcommand{\lgray}[1]{\color{lightgray}{#1}}\) \(\newcommand{\rank}{\operatorname{rank}}\) \(\newcommand{\row}{\text{Row}}\) \(\newcommand{\col}{\text{Col}}\) \(\renewcommand{\row}{\text{Row}}\) \(\newcommand{\nul}{\text{Nul}}\) \(\newcommand{\var}{\text{Var}}\) \(\newcommand{\corr}{\text{corr}}\) \(\newcommand{\len}[1]{\left|#1\right|}\) \(\newcommand{\bbar}{\overline{\bvec}}\) \(\newcommand{\bhat}{\widehat{\bvec}}\) \(\newcommand{\bperp}{\bvec^\perp}\) \(\newcommand{\xhat}{\widehat{\xvec}}\) \(\newcommand{\vhat}{\widehat{\vvec}}\) \(\newcommand{\uhat}{\widehat{\uvec}}\) \(\newcommand{\what}{\widehat{\wvec}}\) \(\newcommand{\Sighat}{\widehat{\Sigma}}\) \(\newcommand{\lt}{<}\) \(\newcommand{\gt}{>}\) \(\newcommand{\amp}{&}\) \(\definecolor{fillinmathshade}{gray}{0.9}\)Z-scores III
Do z-score probabilities always need to be calculated as the chance of a value either above or below a given score? How would you calculate the probability of a z-score between -0.08 and +1.92?
Z-Scores
To calculate the probability of getting a value with a z-score between two other z-scores, you can either use a reference table to look up the value for both scores and subtract them to find the difference, or you can use technology. In this lesson, which is an extension of Z-scores and Z-scores II, we will practice both methods.
Historically, it has been very common to use a z-score probability table like the one below to look up the probability associated with a given z-score:
| Z | 0.00 | 0.01 | 0.02 |
0.03 |
0.04 | 0.05 | 0.06 | 0.07 | 0.08 | 0.09 | Z |
| 0.0 |
.5 |
0.504 |
0.508 |
0.512 |
0.516 |
0.5199 |
0.5239 |
0.5279 |
0.5319 |
0.5359 |
0.0 |
| 0.1 |
0.5398 |
0.5438 |
0.5478 |
0.5517 |
0.5557 |
0.5596 |
0.5636 |
0.5675 |
0.5714 |
0.5753 |
0.1 |
|
0.2 |
0.5793 |
0.5832 |
0.5871 |
0.591 |
0.5948 |
0.5987 |
0.6026 |
0.6064 |
0.6103 |
0.6141 |
0.2 |
| 0.3 |
0.6179 |
0.6217 |
0.6255 |
0.6293 |
0.6331 |
0.6368 |
0.6406 |
0.6443 |
0.648 |
0.6517 |
0.3 |
| 0.4 |
.6554 |
0.6591 |
0.6628 |
0.6664 |
0.67 |
0.6736 |
0.6772 |
0.6808 |
0.6844 |
0.6879 |
0.4 |
| 0.5 |
0.6915 |
0.695 |
0.6985 |
0.7019 |
0.7054 |
0.7088 |
0.7123 |
0.7157 |
0.719 |
0.7224 |
0.5 |
|
0.6 |
0.7257 |
0.7291 |
0.7324 |
0.7357 |
0.7389 |
0.7422 |
0.7454 |
0.7486 |
0.7517 |
0.7549 |
0.6 |
| 0.7 |
0.758 |
0.7611 |
0.7642 |
0.7673 |
0.7704 |
0.7734 |
0.7764 |
0.7794 |
0.7823 |
0.7852 |
0.7 |
| 0.8 |
0.7881 |
0.791 |
0.7939 |
0.7967 |
0.7995 |
0.8023 |
0.8051 |
0.8078 |
0.8106 |
0.8133 |
0.8 |
| 0.9 |
0.8159 |
0.8186 |
0.8212 |
0.8238 |
0.8264 |
0.8289 |
0.8315 |
0.834 |
0.8365 |
0.8389 |
0.9 |
| 1.0 |
0.8413 |
0.8438 |
0.8461 |
0.8485 |
0.8508 |
0.8531 |
0.8554 |
0.8577 |
0.8599 |
0.8621 |
1.0 |
| 1.1 |
0.8643 |
0.8665 |
0.8686 |
0.8708 |
0.8729 |
0.8749 |
0.877 |
0.879 |
0.881 |
0.883 |
1.1 |
| 1.2 |
0.8849 |
0.8869 |
0.8888 |
0.8907 |
0.8925 |
0.8944 |
0.8962 |
0.898 |
0.8997 |
0.9015 |
1.2 |
| 1.3 |
0.9032 |
0.9049 |
0.9066 |
0.9082 |
0.9099 |
0.9115 |
0.9131 |
0.9147 |
0.9162 |
0.9177 |
1.3 |
| 1.4 |
0.9192 |
0.9207 |
0.9222 |
0.9236 |
0.9251 |
0.9265 |
0.9279 |
0.9292 |
0.9306 |
0.9319 |
1.4 |
| 1.5 |
0.9332 |
0.9345 |
0.9357 |
0.937 |
0.9382 |
0.9394 |
0.9406 |
0.9418 |
0.9429 |
0.9441 |
1.5 |
| 1.6 |
0.9452 |
0.9463 |
0.9474 |
0.9484 |
0.9495 |
0.9505 |
0.9515 |
0.9525 |
0.9535 |
0.9545 |
1.6 |
| 1.7 |
0.9554 |
0.9564 |
0.9573 |
0.9582 |
0.9591 |
0.9599 |
0.9608 |
0.9616 |
0.9625 |
0.9633 |
1.7 |
| 1.8 |
0.9641 |
0.9649 |
0.9656 |
0.9664 |
0.9671 |
0.9678 |
0.9686 |
0.9693 |
0.9699 |
0.9706 |
1.8 |
| 1.9 |
0.9713 |
0.9719 |
0.9726 |
0.9732 |
0.9738 |
0.9744 |
0.975 |
0.9756 |
0.9761 |
0.9767 |
1.9 |
| 2.0 |
0.9772 |
0.9778 |
0.9783 |
0.9788 |
0.9793 |
0.9798 |
0.9803 |
0.9808 |
0.9812 |
0.9817 |
2.0 |
| 2.1 |
0.9821 |
0.9826 |
0.983 |
0.9834 |
0.9838 |
0.9842 |
0.9846 |
0.985 |
0.9854 |
0.9857 |
2.1 |
| 2.2 |
0.9861 |
0.9864 |
0.9868 |
0.9871 |
0.9875 |
0.9878 |
0.9881 |
0.9884 |
0.9887 |
0.989 |
2.2 |
| 2.3 |
0.9893 |
0.9896 |
0.9898 |
0.9901 |
0.9904 |
0.9906 |
0.9909 |
0.9911 |
0.9913 |
0.9916 |
2.3 |
| 2.4 |
0.9918 |
0.992 |
0.9922 |
0.9925 |
0.9927 |
0.9929 |
0.9931 |
0.9932 |
0.9934 |
0.9936 |
2.4 |
| 2.5 |
0.9938 |
0.994 |
0.9941 |
0.9943 |
0.9945 |
0.9946 |
0.9948 |
0.9949 |
0.9951 |
0.9952 |
2.5 |
| 2.6 |
0.9953 |
0.9955 |
0.9956 |
0.9957 |
0.9959 |
0.996 |
0.9961 |
0.9962 |
0.9963 |
0.9964 |
2.6 |
| 2.7 |
0.9965 |
0.9966 |
0.9967 |
0.9968 |
0.9969 |
0.997 |
0.9971 |
0.9972 |
0.9973 |
0.9974 |
2.7 |
| 2.8 |
0.9974 |
0.9975 |
0.9976 |
0.9977 |
0.9977 |
0.9978 |
0.9979 |
0.9979 |
0.998 |
0.9981 |
2.8 |
| 2.9 |
0.9981 |
0.9982 |
0.9982 |
0.9983 |
0.9984 |
0.9984 |
0.9985 |
0.9985 |
0.9986 |
0.9986 |
2.9 |
| 3.0 |
0.9987 |
0.9987 |
0.9987 |
0.9988 |
0.9988 |
0.9989 |
0.9989 |
0.9989 |
0.999 |
0.999 |
3.0 |
| 3.1 |
0.999 |
0.9991 |
0.9991 |
0.9991 |
0.9992 |
0.9992 |
0.9992 |
0.9992 |
0.9993 |
0.9993 |
3.1 |
| 3.2 |
0.9993 |
0.9993 |
0.9994 |
0.9994 |
0.9994 |
0.9994 |
0.9994 |
0.9995 |
0.9995 |
0.9995 |
3.2 |
| 3.3 |
0.9995 |
0.9995 |
0.9995 |
0.9996 |
0.9996 |
0.9996 |
0.9996 |
0.9996 |
0.9996 |
0.9997 |
3.3 |
| 3.4 |
0.9997 |
0.9997 |
0.9997 |
0.9997 |
0.9997 |
0.9997 |
0.9997 |
0.9997 |
0.9997 |
0.9998 |
3.4 |
| 3.5 |
0.9998 |
0.9998 |
0.9998 |
0.9998 |
0.9998 |
0.9998 |
0.9998 |
0.9998 |
0.9998 |
0.9998 |
3.5 |
| 3.6 |
0.9998 |
0.9998 |
0.9999 |
0.9999 |
0.9999 |
0.9999 |
0.9999 |
0.9999 |
0.9999 |
0.9999 |
3.6 |
| 3.7 |
0.9999 |
0.9999 |
0.9999 |
0.9999 |
0.9999 |
0.9999 |
0.9999 |
0.9999 |
0.9999 |
0.9999 |
3.7 |
| 3.8 |
0.9999 |
0.9999 |
0.9999 |
0.9999 |
0.9999 |
0.9999 |
0.9999 |
0.9999 |
0.9999 |
0.9999 |
3.8 |
| 3.9 |
1 |
1 |
1 |
1 |
1 |
1 |
1 |
1 |
1 |
1 |
3.9 |
| Z | 0.000 | 0.01 | 0.02 | 0.03 | 0.04 | 0.05 | 0.06 | 0.07 | 0.08 | 0.09 | Z |
Since the proliferation of the Internet, however, you can also use a free online calculator.
Calculating Probability
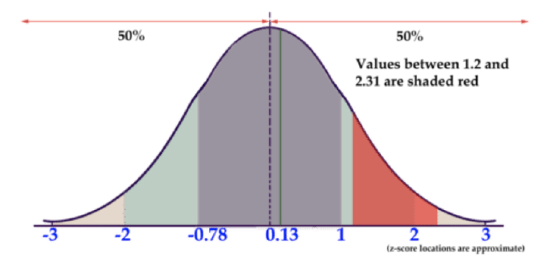
What is the probability associated with a z-score between 1.2 and 2.31?
To evaluate the probability of a value occurring within a given range, you need to find the probability of both the upper and lower values in the range, and subtract to find the difference.

CC BY-NC-SA
- First find z=1.2 on the z-score probability reference above: .8849 Remember that value represents the percentage of values below 1.2.
- Next, find and record the value associated with z=2.31: .9896
- Since approximately 88.49% of all values are below z=1.2 and approximately 98.96% of all values are below z=2.31, there are 98.96%−88.49%=10.47% of values between.
Calculating the Probability of a Value Occurring in a Normal Distribution
1. What is the probability that a value with a z-score between -1.32 and +1.49 will occur in a normal distribution?
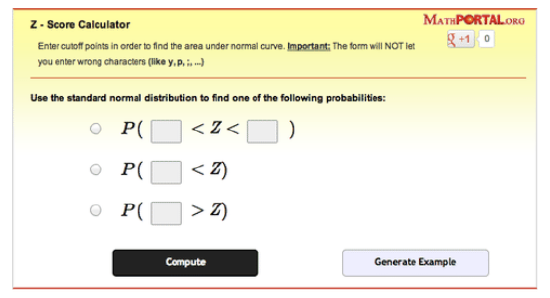
Let’s use the online calculator on "Math Portal" for this one.
When you open the page, you should see a window like this:

CC BY-NC-SA
All you need to do is select the radio button to the left of the first type of probability, input “-1.32” into the first box, and 1.49 into the second. When you click “Compute”, you should get the result
P(−1.32<Z<1.49)=0.8385
Which tells us that there is approximately and 83.85% probability that a value with a z-score between 1.32 and 1.49 will occur in a normal distribution.
Notice that the calculator also details the steps involved with finding the answer:
- Estimate the probability using a graph, so you have an idea of what your answer should be.
- Find the probability of z < 1.49, using a reference. (0.9319)
- Find the probability of z < −1.32, again, using a reference. (0.0934)
- Subtract the values: 0.9319−0.0934=0.8385 or 83.85%
2. What is the probability that a random selection will be between 8.45 and 10.25, if it is from a normal distribution with μ=10 and σ=2?
This question requires us to first find the z-scores for the value 8.45 and 10.25, then calculate the percentage of value between them by using values from a z-score reference and finding the difference.
1. Find the z-score for 8.45, using the z-score formula: (x−μ)/σ
8.45−10/2=−1.55/2≈−0.78
2. Find the z-score for 10.25 the same way:
10.25−10/2=0.25/2≈.13
3. Now find the percentages for each, using a reference (don’t forget we want the probability of values less than our negative score and less than our positive score, so we can find the values between):
P(Z<−0.78)=.2177 or 21.77%
P(Z<.13)=.5517 or 55.17%
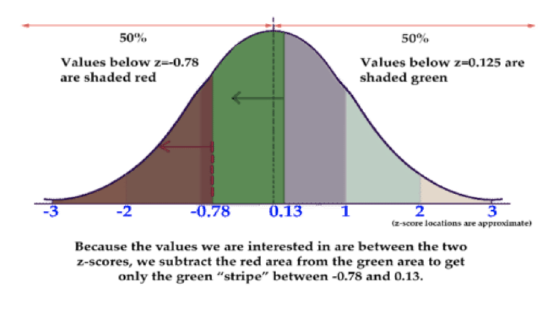
4. At this point, let’s sketch the graph to get an idea what we are looking for:

CC BY-NC-SA
5. Finally, subtract the values to find the difference:
.5517−.2177=.3340 or about 33.4%
There is approximately a 33.4% probability that a value between 8.45 and 10.25 would result from a random selection of a normal distribution with mean 10 and standard deviation 2.
Earlier Problem Revisited
Do z-score probabilities always need to be calculated as the chance of a value either above or below a given score? How would you calculate the probability of a z-score between -0.08 and +1.92?
After this lesson, you should know without question that z-score probabilities do not need to assume only probabilities above or below a given value, the probability between values can also be calculated.
The probability of a z-score below -0.08 is 46.81%, and the probability of a z-score below 1.92 is 97.26%, so the probability between them is 97.26%−46.81%=50.45%.
Examples
- What is the probability of a z-score between -0.93 and 2.11?
- What is P(1.39<Z<2.03)?
- What is P(−2.11<Z<2.11)?
Solutions:
Example 1
What is the probability of a z-score between -0.93 and 2.11
Using the z-score probability table above, we can see that the probability of a value below -0.93 is .1762, and the probability of a value below 2.11 is .9826. Therefore, the probability of a value between them is .9826−.1762=.8064 or 80.64%
Example 2
What is P(1.39<Z<2.03)?
Using the z-score probability table, we see that the probability of a value below z=1.39 is .9177, and a value below z=2.03 is .9788. That means that the probability of a value between them is .9788−.9177=.0611 or 6.11%
Example 3
What is P(−2.11<Z<2.11)?
Using the online calculator on "Math Portal", we select the top calculation with the associated radio button to the left of it, enter “-2.11” in the first box, and “2.11” in the second box. Click “Compute” to get “.9652”, and convert to a percentage. The probability of a z-score between -2.11 and +2.11 is about 96.52%.
Review
Find the probabilities, use the table from the lesson or an online resource.
- What is the probability of a z-score between +1.99 and +2.02?
- What is the probability of a z-score between -1.99 and +2.02?
- What is the probability of a z-score between -1.20 and -1.97?
- What is the probability of a z-score between +2.33 and-0.97?
- What is the probability of a z-score greater than +0.09?
- What is the probability of a z-score greater than -0.02?
- What is P(1.42<Z<2.01)?
- What is P(1.77<Z<2.22)?
- What is P(−2.33<Z<−1.19)?
- What is P(−3.01<Z<−0.71)?
- What is P(2.66<Z<3.71)?
- What is the probability of the random occurrence of a value between 56 and 61 from a normally distributed population with mean 62 and standard deviation 4.5?
- What is the probability of a value between 301 and 329, assuming a normally distributed set with mean 290 and standard deviation 32?
- What is the probability of getting a value between 1.2 and 2.3 from the random output of a normally distributed set with μ=2.6 and σ=.9?
Vocabulary
| Term | Definition |
|---|---|
| z-score | The z -score of a value is the number of standard deviations between the value and the mean of the set. |
| z-score table | A z-score table associates the various common z-scores between 0 and 3.99 with the decimal probability of being less than or equal to that z-score. |
Additional Resources
Practice: Using Tables of the Normal Distribution
Real World: No Country for Old Men

