
7.7: Sampling Distribution of a Sample Mean
- Page ID
- 5740
\( \newcommand{\vecs}[1]{\overset { \scriptstyle \rightharpoonup} {\mathbf{#1}} } \)
\( \newcommand{\vecd}[1]{\overset{-\!-\!\rightharpoonup}{\vphantom{a}\smash {#1}}} \)
\( \newcommand{\dsum}{\displaystyle\sum\limits} \)
\( \newcommand{\dint}{\displaystyle\int\limits} \)
\( \newcommand{\dlim}{\displaystyle\lim\limits} \)
\( \newcommand{\id}{\mathrm{id}}\) \( \newcommand{\Span}{\mathrm{span}}\)
( \newcommand{\kernel}{\mathrm{null}\,}\) \( \newcommand{\range}{\mathrm{range}\,}\)
\( \newcommand{\RealPart}{\mathrm{Re}}\) \( \newcommand{\ImaginaryPart}{\mathrm{Im}}\)
\( \newcommand{\Argument}{\mathrm{Arg}}\) \( \newcommand{\norm}[1]{\| #1 \|}\)
\( \newcommand{\inner}[2]{\langle #1, #2 \rangle}\)
\( \newcommand{\Span}{\mathrm{span}}\)
\( \newcommand{\id}{\mathrm{id}}\)
\( \newcommand{\Span}{\mathrm{span}}\)
\( \newcommand{\kernel}{\mathrm{null}\,}\)
\( \newcommand{\range}{\mathrm{range}\,}\)
\( \newcommand{\RealPart}{\mathrm{Re}}\)
\( \newcommand{\ImaginaryPart}{\mathrm{Im}}\)
\( \newcommand{\Argument}{\mathrm{Arg}}\)
\( \newcommand{\norm}[1]{\| #1 \|}\)
\( \newcommand{\inner}[2]{\langle #1, #2 \rangle}\)
\( \newcommand{\Span}{\mathrm{span}}\) \( \newcommand{\AA}{\unicode[.8,0]{x212B}}\)
\( \newcommand{\vectorA}[1]{\vec{#1}} % arrow\)
\( \newcommand{\vectorAt}[1]{\vec{\text{#1}}} % arrow\)
\( \newcommand{\vectorB}[1]{\overset { \scriptstyle \rightharpoonup} {\mathbf{#1}} } \)
\( \newcommand{\vectorC}[1]{\textbf{#1}} \)
\( \newcommand{\vectorD}[1]{\overrightarrow{#1}} \)
\( \newcommand{\vectorDt}[1]{\overrightarrow{\text{#1}}} \)
\( \newcommand{\vectE}[1]{\overset{-\!-\!\rightharpoonup}{\vphantom{a}\smash{\mathbf {#1}}}} \)
\( \newcommand{\vecs}[1]{\overset { \scriptstyle \rightharpoonup} {\mathbf{#1}} } \)
\(\newcommand{\longvect}{\overrightarrow}\)
\( \newcommand{\vecd}[1]{\overset{-\!-\!\rightharpoonup}{\vphantom{a}\smash {#1}}} \)
\(\newcommand{\avec}{\mathbf a}\) \(\newcommand{\bvec}{\mathbf b}\) \(\newcommand{\cvec}{\mathbf c}\) \(\newcommand{\dvec}{\mathbf d}\) \(\newcommand{\dtil}{\widetilde{\mathbf d}}\) \(\newcommand{\evec}{\mathbf e}\) \(\newcommand{\fvec}{\mathbf f}\) \(\newcommand{\nvec}{\mathbf n}\) \(\newcommand{\pvec}{\mathbf p}\) \(\newcommand{\qvec}{\mathbf q}\) \(\newcommand{\svec}{\mathbf s}\) \(\newcommand{\tvec}{\mathbf t}\) \(\newcommand{\uvec}{\mathbf u}\) \(\newcommand{\vvec}{\mathbf v}\) \(\newcommand{\wvec}{\mathbf w}\) \(\newcommand{\xvec}{\mathbf x}\) \(\newcommand{\yvec}{\mathbf y}\) \(\newcommand{\zvec}{\mathbf z}\) \(\newcommand{\rvec}{\mathbf r}\) \(\newcommand{\mvec}{\mathbf m}\) \(\newcommand{\zerovec}{\mathbf 0}\) \(\newcommand{\onevec}{\mathbf 1}\) \(\newcommand{\real}{\mathbb R}\) \(\newcommand{\twovec}[2]{\left[\begin{array}{r}#1 \\ #2 \end{array}\right]}\) \(\newcommand{\ctwovec}[2]{\left[\begin{array}{c}#1 \\ #2 \end{array}\right]}\) \(\newcommand{\threevec}[3]{\left[\begin{array}{r}#1 \\ #2 \\ #3 \end{array}\right]}\) \(\newcommand{\cthreevec}[3]{\left[\begin{array}{c}#1 \\ #2 \\ #3 \end{array}\right]}\) \(\newcommand{\fourvec}[4]{\left[\begin{array}{r}#1 \\ #2 \\ #3 \\ #4 \end{array}\right]}\) \(\newcommand{\cfourvec}[4]{\left[\begin{array}{c}#1 \\ #2 \\ #3 \\ #4 \end{array}\right]}\) \(\newcommand{\fivevec}[5]{\left[\begin{array}{r}#1 \\ #2 \\ #3 \\ #4 \\ #5 \\ \end{array}\right]}\) \(\newcommand{\cfivevec}[5]{\left[\begin{array}{c}#1 \\ #2 \\ #3 \\ #4 \\ #5 \\ \end{array}\right]}\) \(\newcommand{\mattwo}[4]{\left[\begin{array}{rr}#1 \amp #2 \\ #3 \amp #4 \\ \end{array}\right]}\) \(\newcommand{\laspan}[1]{\text{Span}\{#1\}}\) \(\newcommand{\bcal}{\cal B}\) \(\newcommand{\ccal}{\cal C}\) \(\newcommand{\scal}{\cal S}\) \(\newcommand{\wcal}{\cal W}\) \(\newcommand{\ecal}{\cal E}\) \(\newcommand{\coords}[2]{\left\{#1\right\}_{#2}}\) \(\newcommand{\gray}[1]{\color{gray}{#1}}\) \(\newcommand{\lgray}[1]{\color{lightgray}{#1}}\) \(\newcommand{\rank}{\operatorname{rank}}\) \(\newcommand{\row}{\text{Row}}\) \(\newcommand{\col}{\text{Col}}\) \(\renewcommand{\row}{\text{Row}}\) \(\newcommand{\nul}{\text{Nul}}\) \(\newcommand{\var}{\text{Var}}\) \(\newcommand{\corr}{\text{corr}}\) \(\newcommand{\len}[1]{\left|#1\right|}\) \(\newcommand{\bbar}{\overline{\bvec}}\) \(\newcommand{\bhat}{\widehat{\bvec}}\) \(\newcommand{\bperp}{\bvec^\perp}\) \(\newcommand{\xhat}{\widehat{\xvec}}\) \(\newcommand{\vhat}{\widehat{\vvec}}\) \(\newcommand{\uhat}{\widehat{\uvec}}\) \(\newcommand{\what}{\widehat{\wvec}}\) \(\newcommand{\Sighat}{\widehat{\Sigma}}\) \(\newcommand{\lt}{<}\) \(\newcommand{\gt}{>}\) \(\newcommand{\amp}{&}\) \(\definecolor{fillinmathshade}{gray}{0.9}\)Suppose you have taken several samples of 10 units each from a population of 500 students, and calculated the mean of each sample. How might you use the data you now have to estimate a mean for the entire population?

geralt - pixabay.com/en/personal-group-silhouettes-man-112391/?oq=group
The Mean of Means
In statistics, you often need to take data from a small number of samples and use it to extrapolate an estimate of the parameters of the population the samples were pulled from. Since one of the more common parameters of interest is the mean, it is common to see a distribution of the means of a number of samples (I realize this may be confusing, “sample” here actually refers to the results of several individual samples) from the same population. This distribution is called, appropriately, the “sampling distribution of the sample mean”. We will be investigating the sampling distribution of the sample mean in more detail in the next lesson “The Central Limit Theorem”, but in essence it is simply a representation of the spread of the means of several samples.
Here we will be focusing on a single value in that sampling distribution, the “mean of means”. The mean of means is simply the mean of all of the means of several samples. By calculating the mean of the sample means, you have a single value that can help summarize a lot of data.
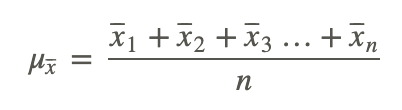
The mean of means, notated here as μx⎯⎯⎯, is actually a pretty straightforward calculation. Simply sum the means of all your samples and divide by the number of means.
As a formula, this looks like:
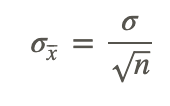
The second common parameter used to define sampling distribution of the sample means is the “standard deviation of the distribution of the sample means”. The only significant difference between the standard deviation of a population and the standard deviation of sample means is that you need to divide the population standard deviation by the square root of the sample size.
As a formula, this looks like:
I recognize that the terminology in this lesson may be getting a bit scary, but the actual concept and the required calculations are actually not particularly difficult. Work your way through the examples below, and I think you will find that the hardest part of this lesson is getting past the wording!
Finding the Mean of Means
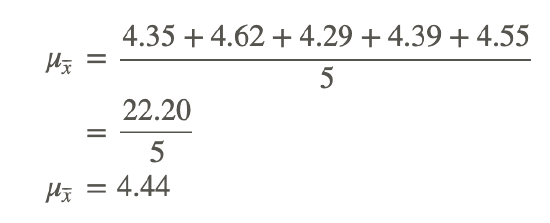
Given the following sample means, what is the mean of means?

To calculate the mean of means, sum the sample means and divide by the number of samples:
Real-World Application: Pizza
Brian works at a pizza restaurant, and has been carefully monitoring the weight of cheese he puts on each pizza for the past week. Each day, Brian tracks the weight of the cheese on each pizza he makes, and calculates the mean weight of cheese on each pizza for that day. If the weights below represent the mean weights for each day, what is the mean of means weight of cheese over the past week? If Brian makes 25 pizzas per day and knows the standard deviation of cheese weight per pizza is 0.5 oz, what is the standard deviation of the sample distribution of the sample means?
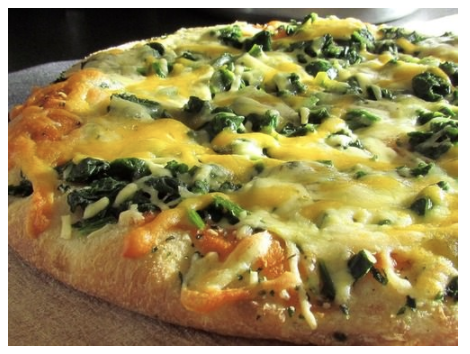
PublicDomainPictures - pixabay.com/en/spinach-pizza-cheese-yellow-white-72123/?oq=cheese%20pizza
|
DAY |
WEIGHT (OZ) |
|
Monday |
7.84 |
|
Tuesday |
7.93 |
|
Wednesday |
7.79 |
|
Thursday |
8.03 |
|
Friday |
8.14 |
|
Saturday |
8.09 |
|
Sunday |
7.88 |
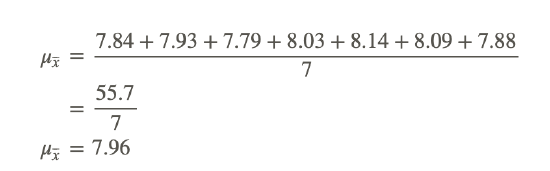
First calculate the mean of means by summing the mean from each day and dividing by the number of days:
Then use the formula to find the standard deviation of the sampling distribution of the sample means:
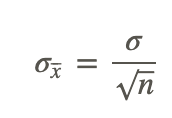
Where σ is the standard deviation of the population, and n is the number of data points in each sampling.
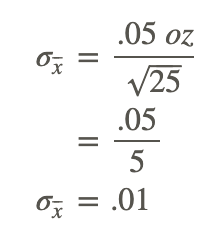
Brian’s research indicates that the cheese he uses per pizza has a mean weight of 7.96 oz, with a standard deviation of .01 oz.
Calculating the Mean
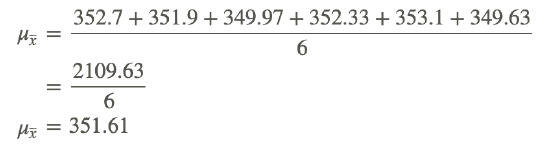
Calculate μx⎯⎯⎯, given the following:
x̄1=352.7
x̄2=351.9
x̄3=349.97
x̄4=352.33
x̄5=353.1
x̄6=349.63
The μx̄ (mean of means) of the given data is:
Earlier Problem Revisited
Suppose you have taken several samples of 10 units each from a population of 500 students, and calculated the mean of each sample. How might you use the data you now have to estimate a mean for the entire population?
You could sum the means of each 10-unit sampling, and divide by the number of samples to get the mean of the means. You could further divide the standard deviation of the entire 500 students (if known) by 10‾‾‾√ (since each sampling contained 10 data points), to find the standard deviation of the distribution of the sample mean.
Examples
Example 1
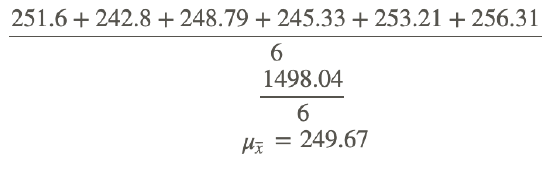
Calculate μx̄ and σx̄, given the following data:
x̄1=251.6
x̄2=242.8
x̄3=248.79
x̄4=245.33
x̄5=253.21
x̄6=256.31
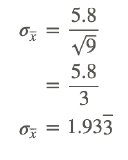
Sample size=9, σ=5.8
First calculate μx̄, using 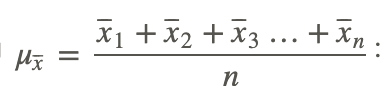
Next calculate σx̄, using 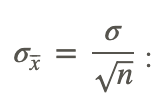
Example 2
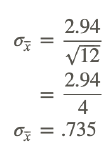
If the σ of a population is 2.94 and 25 samples of 12 samples each are taken, what is σx̄?
To calculate σx̄, use
Example 3
Given the population [1, 2, 3, 4, 5], create a sampling distribution by finding the mean of all possible samples that include four units. How does μx⎯⎯⎯ compare to μ?
This one requires a few steps, first we need to find the mean of each possible sample of four units:
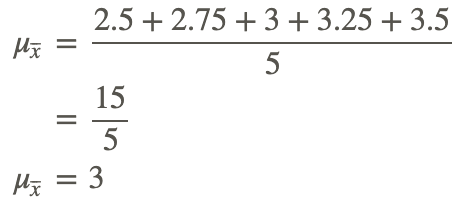
x̄1(1234) has a mean of 2.5
x̄2(1235) has a mean of 2.75
x̄3(1245) has a mean of 3
x̄4(1345) has a mean of 3.25
x̄5(2345) has a mean of 3.5
Next we calculate the mean of means, μx̄, using 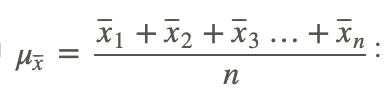
Now we need to calculate μ, using all the population data:
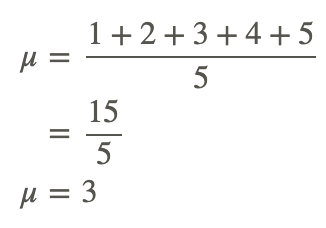
With the given data, μx̄=μ
Review
- Find μx̄, given x̄1=21.0, x̄2=24.3, x̄3=25.0, x̄4=20.6, x̄5=22.3, and x̄6=22.3
- Find μx̄, given x̄1=15.1, x̄2=15.77, x̄3=15.55, x̄4=15.99, x̄5=15.42, and x̄6=15.37
- Find μx̄, given x̄1=341.52, x̄2=345.16, x̄3=343.66, x̄4=345.86, and x̄5=336.10
- Find μx̄, given x̄1=1.41, x̄2=0.59, x̄3=1.44, x̄4=0.93, x̄5=1.44, x̄6=1.01, and x̄7=0.74
- Find μx̄, given x̄1=218.19, x̄2=279.70, x̄3=262.86, and x̄4=243.88
- If the σ of a population is 292.66, and samples of 17 units each are taken, what is σx̄?
- If the σ of a population is 41.39, and 23 samples of 30 samples each are taken, what is σx̄?
- If the σ of a population is 193.61, and samples of 19 units each are taken, what is σx̄?
- If the σ of a population is 91.85, and 129 samples of 11 samples each are taken, what is σx̄?
- If the σ of a population is 255.19, and 43 samples of 31 samples each are taken, what is σx̄?
- Given the population: {1, 2, 3, 4, 5, 6}, create a sampling distribution by finding the mean of all possible samples that include two units. How does μx̄ compare to μ?
- Given the population: {1, 2, 3, 4}, create a sampling distribution by finding the mean of all possible samples that include two units. What is μx̄?
- Given the population: {1, 2, 3, 4, 5}, create a sampling distribution by finding the mean of all possible samples that include two units. How does μx̄ compare to μ?
- Given the population: {1, 2, 3, 4, 5}, create a sampling distribution by finding the mean of all possible samples that include three units. What is μx̄?
- Given the population: {1, 2, 3, 4}, create a sampling distribution by finding the mean of all possible samples that include three units. What is μx̄?
Vocabulary
| Term | Definition |
|---|---|
| mean of means | The mean of means is the overall mean value of the means of several samples from the same population. |
| sampling distribution of the sample means | The sampling distribution of the sample mean is the distribution that describes the spread of the means of multiple samples from the same population. |
| standard deviation of the distribution of sample means | The standard deviation of the distribution of the sample means is a measure of the spread of the random variable x bar. |
Additional Resources
PLIX: Play, Learn, Interact, eXplore - The Mean of the Average Ages
Practice: Sampling Distribution of a Sample Mean
Real World: Cuckoo for Coho Pops