
9.12: F-Distribution
- Page ID
- 5794
\( \newcommand{\vecs}[1]{\overset { \scriptstyle \rightharpoonup} {\mathbf{#1}} } \)
\( \newcommand{\vecd}[1]{\overset{-\!-\!\rightharpoonup}{\vphantom{a}\smash {#1}}} \)
\( \newcommand{\dsum}{\displaystyle\sum\limits} \)
\( \newcommand{\dint}{\displaystyle\int\limits} \)
\( \newcommand{\dlim}{\displaystyle\lim\limits} \)
\( \newcommand{\id}{\mathrm{id}}\) \( \newcommand{\Span}{\mathrm{span}}\)
( \newcommand{\kernel}{\mathrm{null}\,}\) \( \newcommand{\range}{\mathrm{range}\,}\)
\( \newcommand{\RealPart}{\mathrm{Re}}\) \( \newcommand{\ImaginaryPart}{\mathrm{Im}}\)
\( \newcommand{\Argument}{\mathrm{Arg}}\) \( \newcommand{\norm}[1]{\| #1 \|}\)
\( \newcommand{\inner}[2]{\langle #1, #2 \rangle}\)
\( \newcommand{\Span}{\mathrm{span}}\)
\( \newcommand{\id}{\mathrm{id}}\)
\( \newcommand{\Span}{\mathrm{span}}\)
\( \newcommand{\kernel}{\mathrm{null}\,}\)
\( \newcommand{\range}{\mathrm{range}\,}\)
\( \newcommand{\RealPart}{\mathrm{Re}}\)
\( \newcommand{\ImaginaryPart}{\mathrm{Im}}\)
\( \newcommand{\Argument}{\mathrm{Arg}}\)
\( \newcommand{\norm}[1]{\| #1 \|}\)
\( \newcommand{\inner}[2]{\langle #1, #2 \rangle}\)
\( \newcommand{\Span}{\mathrm{span}}\) \( \newcommand{\AA}{\unicode[.8,0]{x212B}}\)
\( \newcommand{\vectorA}[1]{\vec{#1}} % arrow\)
\( \newcommand{\vectorAt}[1]{\vec{\text{#1}}} % arrow\)
\( \newcommand{\vectorB}[1]{\overset { \scriptstyle \rightharpoonup} {\mathbf{#1}} } \)
\( \newcommand{\vectorC}[1]{\textbf{#1}} \)
\( \newcommand{\vectorD}[1]{\overrightarrow{#1}} \)
\( \newcommand{\vectorDt}[1]{\overrightarrow{\text{#1}}} \)
\( \newcommand{\vectE}[1]{\overset{-\!-\!\rightharpoonup}{\vphantom{a}\smash{\mathbf {#1}}}} \)
\( \newcommand{\vecs}[1]{\overset { \scriptstyle \rightharpoonup} {\mathbf{#1}} } \)
\(\newcommand{\longvect}{\overrightarrow}\)
\( \newcommand{\vecd}[1]{\overset{-\!-\!\rightharpoonup}{\vphantom{a}\smash {#1}}} \)
\(\newcommand{\avec}{\mathbf a}\) \(\newcommand{\bvec}{\mathbf b}\) \(\newcommand{\cvec}{\mathbf c}\) \(\newcommand{\dvec}{\mathbf d}\) \(\newcommand{\dtil}{\widetilde{\mathbf d}}\) \(\newcommand{\evec}{\mathbf e}\) \(\newcommand{\fvec}{\mathbf f}\) \(\newcommand{\nvec}{\mathbf n}\) \(\newcommand{\pvec}{\mathbf p}\) \(\newcommand{\qvec}{\mathbf q}\) \(\newcommand{\svec}{\mathbf s}\) \(\newcommand{\tvec}{\mathbf t}\) \(\newcommand{\uvec}{\mathbf u}\) \(\newcommand{\vvec}{\mathbf v}\) \(\newcommand{\wvec}{\mathbf w}\) \(\newcommand{\xvec}{\mathbf x}\) \(\newcommand{\yvec}{\mathbf y}\) \(\newcommand{\zvec}{\mathbf z}\) \(\newcommand{\rvec}{\mathbf r}\) \(\newcommand{\mvec}{\mathbf m}\) \(\newcommand{\zerovec}{\mathbf 0}\) \(\newcommand{\onevec}{\mathbf 1}\) \(\newcommand{\real}{\mathbb R}\) \(\newcommand{\twovec}[2]{\left[\begin{array}{r}#1 \\ #2 \end{array}\right]}\) \(\newcommand{\ctwovec}[2]{\left[\begin{array}{c}#1 \\ #2 \end{array}\right]}\) \(\newcommand{\threevec}[3]{\left[\begin{array}{r}#1 \\ #2 \\ #3 \end{array}\right]}\) \(\newcommand{\cthreevec}[3]{\left[\begin{array}{c}#1 \\ #2 \\ #3 \end{array}\right]}\) \(\newcommand{\fourvec}[4]{\left[\begin{array}{r}#1 \\ #2 \\ #3 \\ #4 \end{array}\right]}\) \(\newcommand{\cfourvec}[4]{\left[\begin{array}{c}#1 \\ #2 \\ #3 \\ #4 \end{array}\right]}\) \(\newcommand{\fivevec}[5]{\left[\begin{array}{r}#1 \\ #2 \\ #3 \\ #4 \\ #5 \\ \end{array}\right]}\) \(\newcommand{\cfivevec}[5]{\left[\begin{array}{c}#1 \\ #2 \\ #3 \\ #4 \\ #5 \\ \end{array}\right]}\) \(\newcommand{\mattwo}[4]{\left[\begin{array}{rr}#1 \amp #2 \\ #3 \amp #4 \\ \end{array}\right]}\) \(\newcommand{\laspan}[1]{\text{Span}\{#1\}}\) \(\newcommand{\bcal}{\cal B}\) \(\newcommand{\ccal}{\cal C}\) \(\newcommand{\scal}{\cal S}\) \(\newcommand{\wcal}{\cal W}\) \(\newcommand{\ecal}{\cal E}\) \(\newcommand{\coords}[2]{\left\{#1\right\}_{#2}}\) \(\newcommand{\gray}[1]{\color{gray}{#1}}\) \(\newcommand{\lgray}[1]{\color{lightgray}{#1}}\) \(\newcommand{\rank}{\operatorname{rank}}\) \(\newcommand{\row}{\text{Row}}\) \(\newcommand{\col}{\text{Col}}\) \(\renewcommand{\row}{\text{Row}}\) \(\newcommand{\nul}{\text{Nul}}\) \(\newcommand{\var}{\text{Var}}\) \(\newcommand{\corr}{\text{corr}}\) \(\newcommand{\len}[1]{\left|#1\right|}\) \(\newcommand{\bbar}{\overline{\bvec}}\) \(\newcommand{\bhat}{\widehat{\bvec}}\) \(\newcommand{\bperp}{\bvec^\perp}\) \(\newcommand{\xhat}{\widehat{\xvec}}\) \(\newcommand{\vhat}{\widehat{\vvec}}\) \(\newcommand{\uhat}{\widehat{\uvec}}\) \(\newcommand{\what}{\widehat{\wvec}}\) \(\newcommand{\Sighat}{\widehat{\Sigma}}\) \(\newcommand{\lt}{<}\) \(\newcommand{\gt}{>}\) \(\newcommand{\amp}{&}\) \(\definecolor{fillinmathshade}{gray}{0.9}\)The F-Distribution
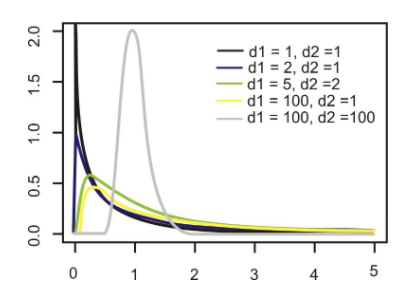
The F-distribution is actually a family of distributions. The specific F-distribution for testing two population variances, σ21 and σ22, is based on two values for degrees of freedom (one for each of the populations). Unlike the normal distribution and the t-distribution, F-distributions are not symmetrical and span only non-negative numbers. (Normal distributions and t-distributions are symmetric and have both positive and negative values.) In addition, the shapes of F-distributions vary drastically, especially when the value for degrees of freedom is small. These characteristics make determining the critical values for F-distributions more complicated than for normal distributions and Student’s t-distributions. F-distributions for various degrees of freedom are shown below:
Statistic
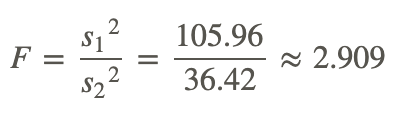
We use the F-ratio test statistic when testing the hypothesis that there is no difference between population variances. When calculating this ratio, we really just need the variance from each of the samples. It is recommended that the larger sample variance be placed in the numerator of the F-ratio and the smaller sample variance in the denominator. By doing this, the ratio will always be greater than 1.00 and will simplify the hypothesis test.
Calculating the F-Ratio
Suppose a teacher administered two different reading programs to two groups of students and collected the following achievement score data:
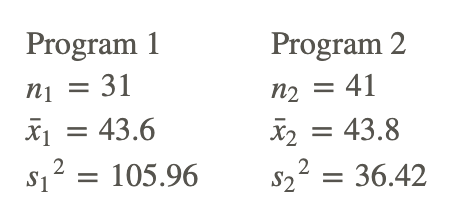
What is the F-ratio for these data?
F-Max Test: Testing Hypotheses about Multiple Independent Population Variances
When we test the hypothesis that two variances of populations from which random samples were selected are equal, H0:σ21=σ22 (or in other words, that the ratio of the variances σ21σ22=1), we call this test the F-Max test. Since we have a null hypothesis of H0:σ21=σ22, our alternative hypothesis would be Ha:σ21≠σ22.
Establishing the critical values in an F-test is a bit more complicated than when doing so in other hypothesis tests. Most tables contain multiple F-distributions, one for each of the following: 1 percent, 5 percent, 10 percent, and 25 percent of the area in the right-hand tail. (Please see the supplemental link for an example of this type of table.) We also need to use the degrees of freedom from each of the samples to determine the critical values.
Determining the Critical Value
Suppose we are trying to determine the critical values for the scenario in the preceding section, and we set the level of significance to 0.02. Because we have a two-tailed test, we assign 0.01 to the area to the right of the positive critical value. Using the F-table for α=0.01, we find the critical value at 2.203, since the numerator has 30 degrees of freedom and the denominator has 40 degrees of freedom.
Once we find our critical values and calculate our test statistic, we perform the hypothesis test the same way we do with the hypothesis tests using the normal distribution and Student’s t-distribution.
Performing a Hypothesis Test
Using our example from the preceding section, suppose a teacher administered two different reading programs to two different groups of students and was interested if one program produced a greater variance in scores. Perform a hypothesis test to answer her question.
For the example, we calculated an F-ratio of 2.909 and found a critical value of 2.203. Since the observed test statistic exceeds the critical value, we reject the null hypothesis. Therefore, we can conclude that the observed ratio of the variances from the independent samples would have occurred by chance if the population variances were equal less than 2% of the time. We can conclude that the variance of the student achievement scores for the second sample is less than the variance of the scores for the first sample. We can also see that the achievement test means are practically equal, so the difference in the variances of the student achievement scores may help the teacher in her selection of a program.
The Limits of Using the F-Distribution to Test Variance
The test of the null hypothesis, H0;σ21=σ22, using the F-distribution is only appropriate when it can safely be assumed that the population is normally distributed. If we are testing the equality of standard deviations between two samples, it is important to remember that the F-test is extremely sensitive. Therefore, if the data displays even small departures from the normal distribution, including non-linearity or outliers, the test is unreliable and should not be used. In the next lesson, we will introduce several tests that we can use when the data are not normally distributed.
Examples
Measurements are taken before and after a specific date. You are interested in whether the population variances are the same before and after. Following is the information you have:
| N | Mean | Standard Deviation | Variance | |
|---|---|---|---|---|
| Before 20 | 2.987 | 6.987 | 48.818 | |
| After 20 | 2,435 | 4.987 | 24.870 |
Example 1
What is the null hypothesis?
Since we are interested in whether or not the variances are the same, the null hypothesis is:
a. What are the null and alternative hypotheses for this scenario?
b. What is the critical value with α=0.10?
c. Calculate the F-ratio.
d. Would you reject or fail to reject the null hypothesis? Explain your reasoning.
e. Interpret the results and determine what the guidance counselor can conclude from this hypothesis test.
- True or False: The test of the null hypothesis, H0:σ21=σ22, using the F-distribution is only appropriate when it can be safely assumed that the population is normally distributed.
- Consider the following table:
| Variable 1 | Variable 2 | |
|---|---|---|
| Mean | 25.642857 | 43.8125 |
| Variance | 15.22619048 | 96.42410714 |
| Observations | 7 | 8 |
| Df | 6 | 7 |
| F | 0.157908545 | |
| P(F f) one tail | 0.01927 | |
| F Critical one-tail | 0.23771837 |
a. What is the null hypothesis?
b. What is the calculated F statistic?
c. What is the decision?
- List the properties of the F distribution.
- Name two differences between the F test and the chi-square test.
- Which of the following statements is correct?
- Just like the chi-square, the F-distribution is skewed.
- The F-distribution is defined by three parameters.
- The two samples used in the F test must be the same size.
- Choose the correct response to complete this sentence: A small value for F will result in
- A non-rejection of the null hypothesis
- A rejection of the null hypothesis
- The test statistic not falling in the acceptance region.
- The F-test is
- Used to carry out a hypothesis test for an analysis of variance.
- A test used to predict the variance when the sample size is unknown.
- Used to carry out a hypothesis test for an analysis of the standard deviation.
- If we are testing is the variances of two populations are equal, what should be the distribution of the underlying populations?
- F-distribution
- Chi-square distribution
- Normal distribution
- A large value of F will result in:
- Rejection of the null hypothesis
- Acceptance of the null hypothesis
- The test statistic falling in the acceptance region.
- A researcher wants to do a hypothesis test regarding the equality of the variances of two normally distributed populations. Which of the following statements are true in this situation?
- The F-statistic is the appropriate test statistic that should be used in this case.
- The chi-square is the appropriate test statistic that should be used in this case.
- If the calculated statistic is within the critical values, then the conclusion would be not to reject the statement that the variances of the two populations are equal.
- If the calculated statistic is within the critical values, then the conclusion would be to reject the statement that the variances of the two populations are equal.
| I | a and b |
|---|---|
| II | a and c |
| III | b and c |
- Which of the following test statistics should be used when doing a hypothesis test for the equality of the variances of two populations?
- T-distribution
- Chi-square
- F-distribution
- The standard deviation of the scores of 20 students in their biology test is 10 and that of their chemistry test is 5. Find the value of the F-test statistic and decide whether the variances for both tests differ at the 0.10 level of significance.
- The sample variances of two populations are 45 (from a sample of size 25) and 78 (from sample of size 16). If the degrees of freedom of the numerator is 15 and that of the denominator is 24 for testing the variances of two populations using the F-test, find the value of the test statistic. At the .05 level of significance, can you accept that the variances are the same?
- You are interested in testing the difference between two population variances. Below is data from the two samples from each of the populations. Find the F-test value.
Sample 1
2 3 4 1 8 2 4 5 1 9 4 2 7 9
Sample 2
2 1 1 4 5 1 1 1 5 7
- The variance of a sample of n = 20 is 62 and the variance of a second sample of n = 15 is 23. At the .10 level of significance, find the F-test value and check whether variances differ significantly.
- Which of the following are true?
I. The mean value of F is approximately zero.
II. The F distribution is a family of curves based on the degrees of freedom of the variance of the numerator.
III. The F distribution is a family of curves based on the degrees of freedom of the variance of the denominator.
a. I and II only
b. II and III only
c. I only
d. Neither I nor II
- The basic assumption(s) for estimating the difference between two variances is/are:
I. The samples must be dependent on each other.
II. The samples must be independent of each other.
III. The populations from which the samples were drawn must be normally distributed.
IV. The populations from which the samples were drawn must depart from normality.
a. I and III only
b. II and III only
c. II and IV only
d. I and IV only
- Find the value of the F test statistic and the critical value, at the .05 level of significance, for testing the equality of population variances. The sample data is below.
| Sample Size | Sample variance |
|---|---|
| 30 | 12 |
| 25 | 8 |
Vocabulary
| Term | Definition |
|---|---|
| F-distribution | The F-distribution is a family of distributions used for testing two population variances and is based on two values for degrees of freedom (one for each of the populations). |
| F-max test | The F-max test is used when testing the hypothesis that two variances of populations from which random samples were selected are equal. |
| F-ratio test statistic | The F-ratio test statistic is found by putting the larger sample variance in the numerator of the F-ratio and the smaller sample variance in the denominator |
Additional Resources
Video: F-Test for Variances
Practice: F-Distribution