
2.2.2: Trig Function Applications
- Page ID
- 14307
\( \newcommand{\vecs}[1]{\overset { \scriptstyle \rightharpoonup} {\mathbf{#1}} } \)
\( \newcommand{\vecd}[1]{\overset{-\!-\!\rightharpoonup}{\vphantom{a}\smash {#1}}} \)
\( \newcommand{\dsum}{\displaystyle\sum\limits} \)
\( \newcommand{\dint}{\displaystyle\int\limits} \)
\( \newcommand{\dlim}{\displaystyle\lim\limits} \)
\( \newcommand{\id}{\mathrm{id}}\) \( \newcommand{\Span}{\mathrm{span}}\)
( \newcommand{\kernel}{\mathrm{null}\,}\) \( \newcommand{\range}{\mathrm{range}\,}\)
\( \newcommand{\RealPart}{\mathrm{Re}}\) \( \newcommand{\ImaginaryPart}{\mathrm{Im}}\)
\( \newcommand{\Argument}{\mathrm{Arg}}\) \( \newcommand{\norm}[1]{\| #1 \|}\)
\( \newcommand{\inner}[2]{\langle #1, #2 \rangle}\)
\( \newcommand{\Span}{\mathrm{span}}\)
\( \newcommand{\id}{\mathrm{id}}\)
\( \newcommand{\Span}{\mathrm{span}}\)
\( \newcommand{\kernel}{\mathrm{null}\,}\)
\( \newcommand{\range}{\mathrm{range}\,}\)
\( \newcommand{\RealPart}{\mathrm{Re}}\)
\( \newcommand{\ImaginaryPart}{\mathrm{Im}}\)
\( \newcommand{\Argument}{\mathrm{Arg}}\)
\( \newcommand{\norm}[1]{\| #1 \|}\)
\( \newcommand{\inner}[2]{\langle #1, #2 \rangle}\)
\( \newcommand{\Span}{\mathrm{span}}\) \( \newcommand{\AA}{\unicode[.8,0]{x212B}}\)
\( \newcommand{\vectorA}[1]{\vec{#1}} % arrow\)
\( \newcommand{\vectorAt}[1]{\vec{\text{#1}}} % arrow\)
\( \newcommand{\vectorB}[1]{\overset { \scriptstyle \rightharpoonup} {\mathbf{#1}} } \)
\( \newcommand{\vectorC}[1]{\textbf{#1}} \)
\( \newcommand{\vectorD}[1]{\overrightarrow{#1}} \)
\( \newcommand{\vectorDt}[1]{\overrightarrow{\text{#1}}} \)
\( \newcommand{\vectE}[1]{\overset{-\!-\!\rightharpoonup}{\vphantom{a}\smash{\mathbf {#1}}}} \)
\( \newcommand{\vecs}[1]{\overset { \scriptstyle \rightharpoonup} {\mathbf{#1}} } \)
\(\newcommand{\longvect}{\overrightarrow}\)
\( \newcommand{\vecd}[1]{\overset{-\!-\!\rightharpoonup}{\vphantom{a}\smash {#1}}} \)
\(\newcommand{\avec}{\mathbf a}\) \(\newcommand{\bvec}{\mathbf b}\) \(\newcommand{\cvec}{\mathbf c}\) \(\newcommand{\dvec}{\mathbf d}\) \(\newcommand{\dtil}{\widetilde{\mathbf d}}\) \(\newcommand{\evec}{\mathbf e}\) \(\newcommand{\fvec}{\mathbf f}\) \(\newcommand{\nvec}{\mathbf n}\) \(\newcommand{\pvec}{\mathbf p}\) \(\newcommand{\qvec}{\mathbf q}\) \(\newcommand{\svec}{\mathbf s}\) \(\newcommand{\tvec}{\mathbf t}\) \(\newcommand{\uvec}{\mathbf u}\) \(\newcommand{\vvec}{\mathbf v}\) \(\newcommand{\wvec}{\mathbf w}\) \(\newcommand{\xvec}{\mathbf x}\) \(\newcommand{\yvec}{\mathbf y}\) \(\newcommand{\zvec}{\mathbf z}\) \(\newcommand{\rvec}{\mathbf r}\) \(\newcommand{\mvec}{\mathbf m}\) \(\newcommand{\zerovec}{\mathbf 0}\) \(\newcommand{\onevec}{\mathbf 1}\) \(\newcommand{\real}{\mathbb R}\) \(\newcommand{\twovec}[2]{\left[\begin{array}{r}#1 \\ #2 \end{array}\right]}\) \(\newcommand{\ctwovec}[2]{\left[\begin{array}{c}#1 \\ #2 \end{array}\right]}\) \(\newcommand{\threevec}[3]{\left[\begin{array}{r}#1 \\ #2 \\ #3 \end{array}\right]}\) \(\newcommand{\cthreevec}[3]{\left[\begin{array}{c}#1 \\ #2 \\ #3 \end{array}\right]}\) \(\newcommand{\fourvec}[4]{\left[\begin{array}{r}#1 \\ #2 \\ #3 \\ #4 \end{array}\right]}\) \(\newcommand{\cfourvec}[4]{\left[\begin{array}{c}#1 \\ #2 \\ #3 \\ #4 \end{array}\right]}\) \(\newcommand{\fivevec}[5]{\left[\begin{array}{r}#1 \\ #2 \\ #3 \\ #4 \\ #5 \\ \end{array}\right]}\) \(\newcommand{\cfivevec}[5]{\left[\begin{array}{c}#1 \\ #2 \\ #3 \\ #4 \\ #5 \\ \end{array}\right]}\) \(\newcommand{\mattwo}[4]{\left[\begin{array}{rr}#1 \amp #2 \\ #3 \amp #4 \\ \end{array}\right]}\) \(\newcommand{\laspan}[1]{\text{Span}\{#1\}}\) \(\newcommand{\bcal}{\cal B}\) \(\newcommand{\ccal}{\cal C}\) \(\newcommand{\scal}{\cal S}\) \(\newcommand{\wcal}{\cal W}\) \(\newcommand{\ecal}{\cal E}\) \(\newcommand{\coords}[2]{\left\{#1\right\}_{#2}}\) \(\newcommand{\gray}[1]{\color{gray}{#1}}\) \(\newcommand{\lgray}[1]{\color{lightgray}{#1}}\) \(\newcommand{\rank}{\operatorname{rank}}\) \(\newcommand{\row}{\text{Row}}\) \(\newcommand{\col}{\text{Col}}\) \(\renewcommand{\row}{\text{Row}}\) \(\newcommand{\nul}{\text{Nul}}\) \(\newcommand{\var}{\text{Var}}\) \(\newcommand{\corr}{\text{corr}}\) \(\newcommand{\len}[1]{\left|#1\right|}\) \(\newcommand{\bbar}{\overline{\bvec}}\) \(\newcommand{\bhat}{\widehat{\bvec}}\) \(\newcommand{\bperp}{\bvec^\perp}\) \(\newcommand{\xhat}{\widehat{\xvec}}\) \(\newcommand{\vhat}{\widehat{\vvec}}\) \(\newcommand{\uhat}{\widehat{\uvec}}\) \(\newcommand{\what}{\widehat{\wvec}}\) \(\newcommand{\Sighat}{\widehat{\Sigma}}\) \(\newcommand{\lt}{<}\) \(\newcommand{\gt}{>}\) \(\newcommand{\amp}{&}\) \(\definecolor{fillinmathshade}{gray}{0.9}\)Use a calculator to find sine, cosine, and tangent in basic applications
Modeling Periodic Behavior
This lesson will explore how real life examples of periodic behavior can be modeled with Trigonometric Functions. In other words, items that are in motion - such as a wheel turning or waves moving - can be modeled and understood through Trigonometry.
Warm-Up
Trigonometric functions like sine and cosine display periodic behavior when graphed. Use the interactive below to see the periodic behavior of the sine function. Later in this section you will see how real world problems can be modeled and solved with functions similar to these.
Add interactive element text here. This box will NOT print up in pdfs
Work it Out 1
Two students, Manny and Julisa, were having a debate about the how to model the wavelength of their school's radio station frequency. To simplify their debate, they used another model of a wave as shown below.

Manny says the equation for the above graph is \(f(x)=5 \sin\left(x−\dfrac{\pi}{2}\right)\) and Julisa says it is \(f(x)=5 \cos x\).
- Without graphing the equations, can you tell which student is correct, and if so, who?
- How do you know?
- What would the graph of the incorrect equation look like when compared to the graph above?
Discussion
Recall that the equation for a cosine function is \(y=A\cos(w(x−h))+k\) where \(A\) changes the amplitude (the distance between the midpoint and the peak or valley of the graph), h changes the start of a phase (the movement of the graph left and right on the axes), \(k\) changes the midline, and w changes the period from the basic function, which occurs between 0 and \(2\pi\). We can tell that this graph has an amplitude of + 5, and a period of 1.
But is it a cosine function like Julisa believes, or a sine function with a shift in the phase like Manny believes? If you graph these two functions, and also \(y=5 \sin x\) you will see the subtle, but important differences between the three graphs.
Work it Out 2
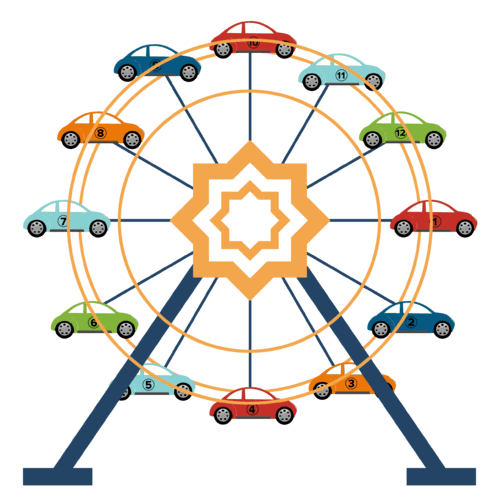
A large Ferris wheel is 100 feet in diameter and has 12 passenger cars. The Ferris wheel rotates counterclockwise, and takes 1 minute to complete a full rotation. Riders climb a stairway in order to board from a platform that is 60 feet above the ground, and is horizontal to the center of the Ferris wheel. In this scenario, the height of a car is the distance between the car and the platform (not the height of the car from the ground). The co-height is the horizontal distance between the car and a vertical line that runs up and down through the center of the Ferris wheel. In other words, if the car was located at an \((x,y)\) coordinate, the co-height is \(x\) and the height is \(y\).
- Let \(\theta =0\) represent the position of Car 1 in the scenario above. Sketch graphs of the height and co-height of Car 1 as functions of \(\theta\), the number of radians through which the car has rotated.
- What is the amplitude of the height and co-height functions for the Ferris wheel?
- If \(X(\theta)\) represents the co-height and \(Y(\theta)\) represents the height of the car, what trigonometric functions would represent the co-height and height in terms of \(\theta\) ?
Discussion
To determine the height of Car 1 as the Ferris wheel rotates, consider that after 15 seconds (which is \(\dfrac{1}{4}\) of the way around or \(\dfrac{\pi}{2}\) radians), the car is at the top of the wheel, which we know is 50 feet above the platform. How high will the car be 15 seconds after that? After a total of 45 seconds? After 1 minute of rotation?
The graph below represents the co-height of the car. At 0 seconds, the car is 50 feet away from the center of the wheel. When the car is at \(\pi\) radians, how far will it be from the vertical line that goes through the center of the Ferris wheel? Why are some of the values of the co-height below negative numbers?
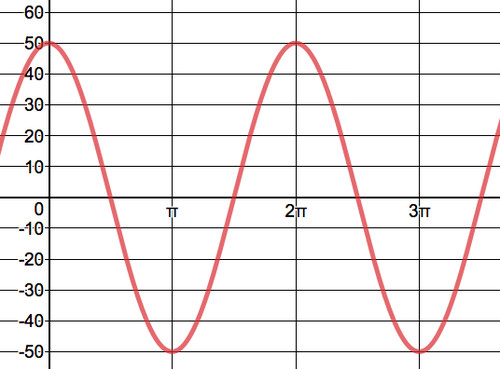
The amplitude of the function of the co-height is 50 because the car will range between +50 and -50 feet away from a vertical line (like the \(y\)-axis) going through the center of the Ferris wheel. Therefore, the co-height can be represented by the function \(f(\theta )=50 \cos(\theta)\).
Don't forget: you still need to create a graph and find the function for the height of Car 1.
Using the Ferris wheel scenario from above, how would you represent the height of a car as the distance from the ground? How would the co-height be impacted by measuring the height from the ground instead of from the platform? What would graphs of the height and co-height look like?
Solution
The co-height will not change, because the horizontal distance between the car and the vertical line through the center of the Ferris wheel won't be affected by the height of the platform or the position of Car 1 when riders get on.
In this example, since you are measuring the height of Car 1 from the ground, the highest point the car reaches will be 50 feet (the radius of the wheel) plus 60 feet (the height of the platform), or 110 feet. The lowest point the car reaches will be -50 feet (below the center of the wheel) plus 60 feet (the height of the platform), or 10 feet from the ground. The graph for the height as a function of the amount of rotations is below.
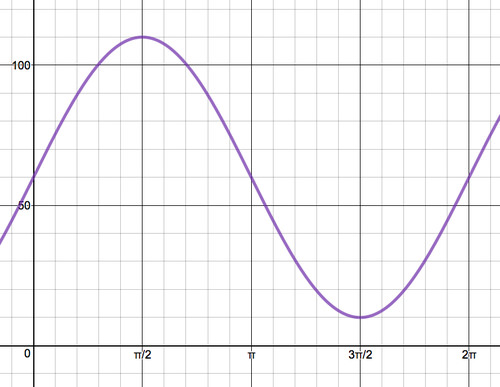
The above is a graph of the function \(Y(\theta )=50 \sin \theta +60\).
A Ferris wheel is 40 feet tall. There is a 25 foot platform to get into the first car, which loads from the bottom of the wheel (not the side as in previous examples). Additionally, the Ferris wheel rotates counterclockwise, making one complete rotation every 2 minutes. Write and graph the functions for the height (from the ground) and co-height of the Ferris wheel in terms of time (in minutes).
Solution
Let t = time. Start by determining the values for A, w, h, and k for both the height and co-height.
Co-Height:
- The wheel is 40 feet in diameter, so it will have maximum and minimum co-heights of 20 feet and -20 feet respective to the midline. Therefore, the Amplitude (A)=20.
- The wheel rotates once every 2 minutes. Because the passengers board from the bottom, which is a -14 clockwise rotation from the x-axis, the Ferris wheel needs to rotate +14 counter-clockwise so that the co-height is at its maximum of +20 feet. This quarter rotation takes 12 of a minute, and therefore the value of h (the phase shift) is 12.
- After 1 minute, the Ferris wheel has made a rotation of \pi . Therefore, the period (w)=\pi .
- The co-height is not affected by the location of the center of the wheel. Therefore, k=0.
- The equation for the co-height is: \(X(t)=20 \cos(\pi (x−\dfrac{1}{2}))\).
Height:
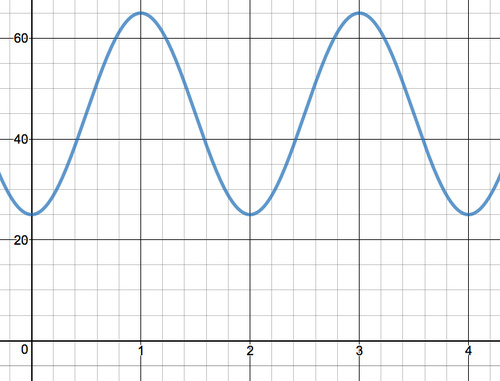
- To determine the height of Car 1 from the ground, you will need to adjust for the height of the platform. The platform adds 25 feet to the bottom of the Ferris wheel, which makes the center 20 feet + 25 feet (or 45 feet) above the ground. This means the height of Car 1, in relation to the ground, is 25 feet at the lowest point and 65 at the highest point, with k=45.
- The equation for the height is: \(Y(t)=20 \sin(\pi (x−\dfrac{1}{2}))+45\).
The graph of the height as a function of time, with Car 1 starting at the bottom of the wheel and rotating clockwise, looks like this:
Add interactive element text here. This box will NOT print up in pdfs
This video demonstrates how to solve a similar Ferris wheel problem.
Work it Out 3
You and two friends are riding the Ferris wheel in Example 2. You are in Car 1, another friend is in Car 3, and the third friend is in Car 5. When you reach the top of the wheel you look down to see your friends somewhere below you. How much higher is your car than Car 3 and Car 5?
Discussion
When you are at the top of the wheel, how high up will you be? And how much of a turn, in radians, will you have made? Consider where the other cars are in the circle; in other words, how much of a turn (again in radians) will Cars 3 and 5 have made?
Given the amplitude (20 feet) and the height of the platform (25 feet), your height will be 45 feet at the top of the wheel, which is \(\pi\) radians from the starting place. At this point, let's say your friend in Car 3 has rotated \(120^{\circ}\) from the starting place, which is 13 of a full turn. How do you use this information and the equation for the height of the Ferris wheel to determine the height of Car 3?
Because you only need to measure the height of the cars, the speed of the Ferris wheel isn't included in the equation, which changes the value of w. Additionally, change the measurement of the turn into radians. What will the equation be without w?
You should get: \(Y(t)=20 \sin\left(x−\dfrac{\pi}{2}\right)+45\). Next, plug in the part of the turn Car 3 has made (in radians) and solve:
\(\begin{aligned} X(t)&=20 \sin \left(\dfrac{2\pi}{3}−\dfrac{\pi}{2}\right)+45 \\ X(t)&=20 \sin\left(\dfrac{\pi}{6}\right)+45 \\ X(t)&=55\end{aligned}\)
This means you are 65 feet - 55 feet = 10 feet higher than your friend in Car 3.
How much higher are you than your friend in Car 5 if the cars are spaced evenly apart?
What would change about the process for solving this problem if instead of there being 12 cars, there were only 8 cars? What about if there were twice as many cars?
Other Models of Periodic Behavior
This lesson modeled periodic behavior by using the rotation of a car around a Ferris wheel to explore the connections between transformed trigonometric functions and their graphs based on real life scenarios. However, rotating Ferris wheels are far from the only "real" things that can be modeled with trigonometric functions, or that have periodic behavior.
For example, high tides and low tides can be modeled and predicted using periodic functions because scientists can determine the height of the water at different times of the day (when the water level is low, the tide is low). Sound waves, blood pressure, and temperature variations can all be modeled as periodic functions, too.
CK-12 Interactive
Review
- For the graphs below, identify the value of the amplitude, period, frequency, phase shift, and midline. Then write the equation for the graph.
-
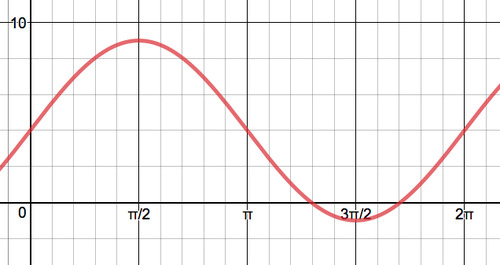
Figure \(\PageIndex{5}\) -
Figure \(\PageIndex{6}\) -
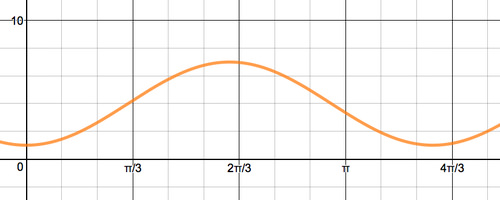
Figure \(\PageIndex{7}\)
-
- The Anansi the Spider ride is a small Ferris wheel at a children's amusement park. There are 8 cars on the ride, spaced every \(45^{\circ}\). The Ferris wheel is 16 feet from top to bottom, and kids load into Car 1 from below on a platform that is 4 feet off the ground. The ride takes 1 minute for a full rotation.
- Sketch a function for the height of Car 1 with respect to time as the Ferris wheel rotates for three minutes.
- Find a formula for the function you've graphed above.
- Determine a different function that will have the same graph you sketched in part a.
- You are standing on a pier and measuring the height of the water below you at different times each day. At 3 pm, the water level is at 7 feet. By 9 pm the water has dropped down to 1 foot. And by 3 am, the water level is back up at 7 feet.
- Sketch the graph given the information you have.
- Determine the amplitude, phase shift, period, and midline. [Hint: The tide takes 12 hours to go through a full rotation of \(2\pi\), so what would be the period if you're measuring in hours?]
- Derive a formula that would model the height of water starting at 12 pm on the first day, and which shows the height of the water over a 24 hour period.
- Graph your formula using a graphing calculator or program to confirm your responses for parts a-c are correct.
- What would be the height of the water at 6 am?
- The outside temperature (in Fahrenheit) was collected hourly on a cold winter day over a 24 hour period. At 12 pm, the temperature was \(30^{\circ}\). By 6 pm it had reached \(50^{\circ}\), the warmest recorded temperature during the measurement period. By 6 am, the temperature had dropped to its lowest point of \(10^{\circ}\).
- Sketch a graph given the information you have.
- Determine the amplitude, phase shift, period, and midline of your graph.
- Derive a formula that models the temperature over a 24-hour period.