
2.7.4: Sine and Cosecant Graphs
- Page ID
- 14940
\( \newcommand{\vecs}[1]{\overset { \scriptstyle \rightharpoonup} {\mathbf{#1}} } \)
\( \newcommand{\vecd}[1]{\overset{-\!-\!\rightharpoonup}{\vphantom{a}\smash {#1}}} \)
\( \newcommand{\id}{\mathrm{id}}\) \( \newcommand{\Span}{\mathrm{span}}\)
( \newcommand{\kernel}{\mathrm{null}\,}\) \( \newcommand{\range}{\mathrm{range}\,}\)
\( \newcommand{\RealPart}{\mathrm{Re}}\) \( \newcommand{\ImaginaryPart}{\mathrm{Im}}\)
\( \newcommand{\Argument}{\mathrm{Arg}}\) \( \newcommand{\norm}[1]{\| #1 \|}\)
\( \newcommand{\inner}[2]{\langle #1, #2 \rangle}\)
\( \newcommand{\Span}{\mathrm{span}}\)
\( \newcommand{\id}{\mathrm{id}}\)
\( \newcommand{\Span}{\mathrm{span}}\)
\( \newcommand{\kernel}{\mathrm{null}\,}\)
\( \newcommand{\range}{\mathrm{range}\,}\)
\( \newcommand{\RealPart}{\mathrm{Re}}\)
\( \newcommand{\ImaginaryPart}{\mathrm{Im}}\)
\( \newcommand{\Argument}{\mathrm{Arg}}\)
\( \newcommand{\norm}[1]{\| #1 \|}\)
\( \newcommand{\inner}[2]{\langle #1, #2 \rangle}\)
\( \newcommand{\Span}{\mathrm{span}}\) \( \newcommand{\AA}{\unicode[.8,0]{x212B}}\)
\( \newcommand{\vectorA}[1]{\vec{#1}} % arrow\)
\( \newcommand{\vectorAt}[1]{\vec{\text{#1}}} % arrow\)
\( \newcommand{\vectorB}[1]{\overset { \scriptstyle \rightharpoonup} {\mathbf{#1}} } \)
\( \newcommand{\vectorC}[1]{\textbf{#1}} \)
\( \newcommand{\vectorD}[1]{\overrightarrow{#1}} \)
\( \newcommand{\vectorDt}[1]{\overrightarrow{\text{#1}}} \)
\( \newcommand{\vectE}[1]{\overset{-\!-\!\rightharpoonup}{\vphantom{a}\smash{\mathbf {#1}}}} \)
\( \newcommand{\vecs}[1]{\overset { \scriptstyle \rightharpoonup} {\mathbf{#1}} } \)
\( \newcommand{\vecd}[1]{\overset{-\!-\!\rightharpoonup}{\vphantom{a}\smash {#1}}} \)
\(\newcommand{\avec}{\mathbf a}\) \(\newcommand{\bvec}{\mathbf b}\) \(\newcommand{\cvec}{\mathbf c}\) \(\newcommand{\dvec}{\mathbf d}\) \(\newcommand{\dtil}{\widetilde{\mathbf d}}\) \(\newcommand{\evec}{\mathbf e}\) \(\newcommand{\fvec}{\mathbf f}\) \(\newcommand{\nvec}{\mathbf n}\) \(\newcommand{\pvec}{\mathbf p}\) \(\newcommand{\qvec}{\mathbf q}\) \(\newcommand{\svec}{\mathbf s}\) \(\newcommand{\tvec}{\mathbf t}\) \(\newcommand{\uvec}{\mathbf u}\) \(\newcommand{\vvec}{\mathbf v}\) \(\newcommand{\wvec}{\mathbf w}\) \(\newcommand{\xvec}{\mathbf x}\) \(\newcommand{\yvec}{\mathbf y}\) \(\newcommand{\zvec}{\mathbf z}\) \(\newcommand{\rvec}{\mathbf r}\) \(\newcommand{\mvec}{\mathbf m}\) \(\newcommand{\zerovec}{\mathbf 0}\) \(\newcommand{\onevec}{\mathbf 1}\) \(\newcommand{\real}{\mathbb R}\) \(\newcommand{\twovec}[2]{\left[\begin{array}{r}#1 \\ #2 \end{array}\right]}\) \(\newcommand{\ctwovec}[2]{\left[\begin{array}{c}#1 \\ #2 \end{array}\right]}\) \(\newcommand{\threevec}[3]{\left[\begin{array}{r}#1 \\ #2 \\ #3 \end{array}\right]}\) \(\newcommand{\cthreevec}[3]{\left[\begin{array}{c}#1 \\ #2 \\ #3 \end{array}\right]}\) \(\newcommand{\fourvec}[4]{\left[\begin{array}{r}#1 \\ #2 \\ #3 \\ #4 \end{array}\right]}\) \(\newcommand{\cfourvec}[4]{\left[\begin{array}{c}#1 \\ #2 \\ #3 \\ #4 \end{array}\right]}\) \(\newcommand{\fivevec}[5]{\left[\begin{array}{r}#1 \\ #2 \\ #3 \\ #4 \\ #5 \\ \end{array}\right]}\) \(\newcommand{\cfivevec}[5]{\left[\begin{array}{c}#1 \\ #2 \\ #3 \\ #4 \\ #5 \\ \end{array}\right]}\) \(\newcommand{\mattwo}[4]{\left[\begin{array}{rr}#1 \amp #2 \\ #3 \amp #4 \\ \end{array}\right]}\) \(\newcommand{\laspan}[1]{\text{Span}\{#1\}}\) \(\newcommand{\bcal}{\cal B}\) \(\newcommand{\ccal}{\cal C}\) \(\newcommand{\scal}{\cal S}\) \(\newcommand{\wcal}{\cal W}\) \(\newcommand{\ecal}{\cal E}\) \(\newcommand{\coords}[2]{\left\{#1\right\}_{#2}}\) \(\newcommand{\gray}[1]{\color{gray}{#1}}\) \(\newcommand{\lgray}[1]{\color{lightgray}{#1}}\) \(\newcommand{\rank}{\operatorname{rank}}\) \(\newcommand{\row}{\text{Row}}\) \(\newcommand{\col}{\text{Col}}\) \(\renewcommand{\row}{\text{Row}}\) \(\newcommand{\nul}{\text{Nul}}\) \(\newcommand{\var}{\text{Var}}\) \(\newcommand{\corr}{\text{corr}}\) \(\newcommand{\len}[1]{\left|#1\right|}\) \(\newcommand{\bbar}{\overline{\bvec}}\) \(\newcommand{\bhat}{\widehat{\bvec}}\) \(\newcommand{\bperp}{\bvec^\perp}\) \(\newcommand{\xhat}{\widehat{\xvec}}\) \(\newcommand{\vhat}{\widehat{\vvec}}\) \(\newcommand{\uhat}{\widehat{\uvec}}\) \(\newcommand{\what}{\widehat{\wvec}}\) \(\newcommand{\Sighat}{\widehat{\Sigma}}\) \(\newcommand{\lt}{<}\) \(\newcommand{\gt}{>}\) \(\newcommand{\amp}{&}\) \(\definecolor{fillinmathshade}{gray}{0.9}\)Wave based on y value and radius of a circle; graph based on the reciprocal.
Sine and Cosecant Graphs
Imagine for a moment that you have a clock that has only one hand - that rotates counterclockwise! However, the hand is very slim all the way until the tip, where there is a ball on the end. In fact, the hand is so slim you won't notice it. You only notice the ball on the end of the rotating hand. This hand is rotating faster than normal. Here is a picture of the clock:
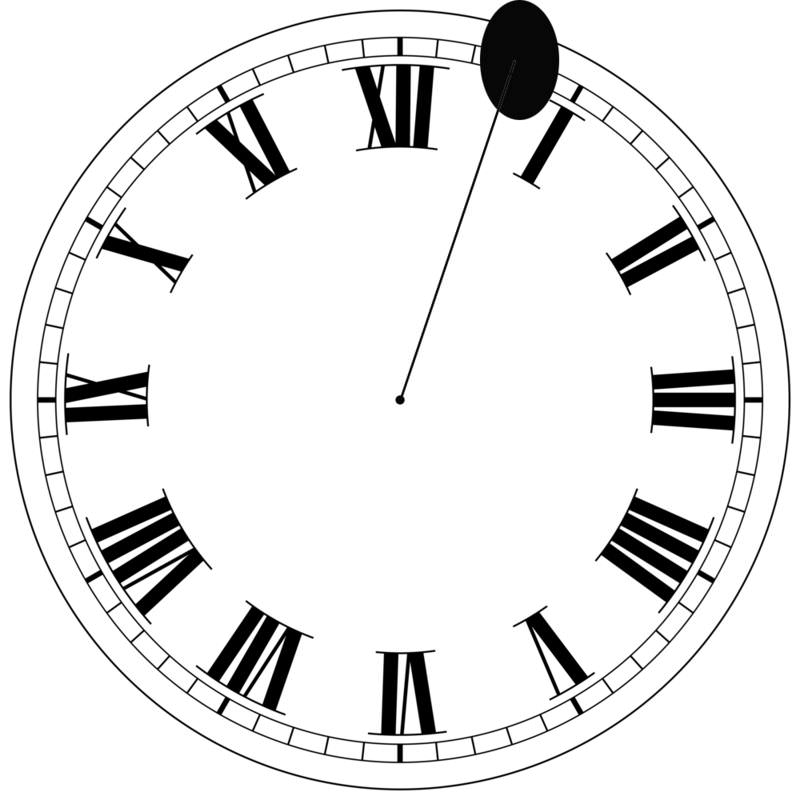
Consider what it would be like if you put a light next to the clock and let the shadow of the hands fall on the far wall.
What pattern would that shadow trace out? If you think about it, you might realize that the shadow would make an up and down motion, over and over as the hand of the clock rotated. Now imagine that instead of a wall, there was a large piece of paper for the shadow to fall on. And wherever the shadow fell, there would be a mark on the paper. Finally, imagine moving the paper as the clock rotates. Can you imagine sort of pattern this would trace out?
Sine and Cosecant Graphs
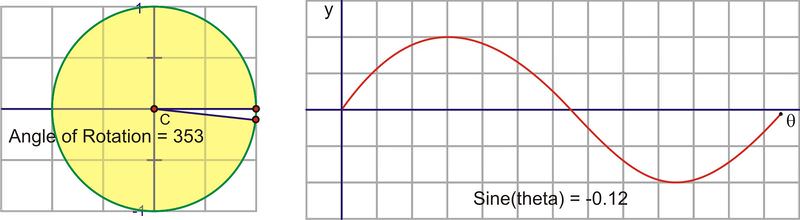
By now, you have become very familiar with the specific values of sine, cosine, and tangents for certain angles of rotation around the coordinate grid. In mathematics, we can often learn a lot by looking at how one quantity changes as we consistently vary another. We will be looking at the sine value as a function of the angle of rotation around the coordinate plane. We refer to any such function as a circular function, because they can be defined using the unit circle. Recall from earlier sections that the sine of an angle in standard position is the ratio of \(\dfrac{y}{r}\), where \(y\) is the \(y\)−coordinate of any point on the circle and \(r\) is the distance from the origin to that point.
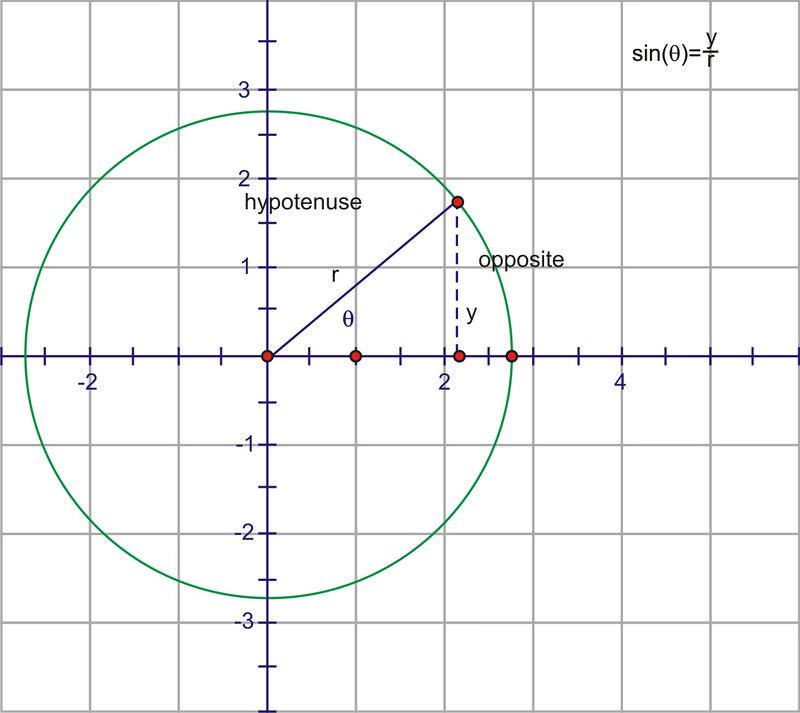
Because the ratios are the same for a given angle, regardless of the length of the radius r, we can use the unit circle as a basis for all calculations.
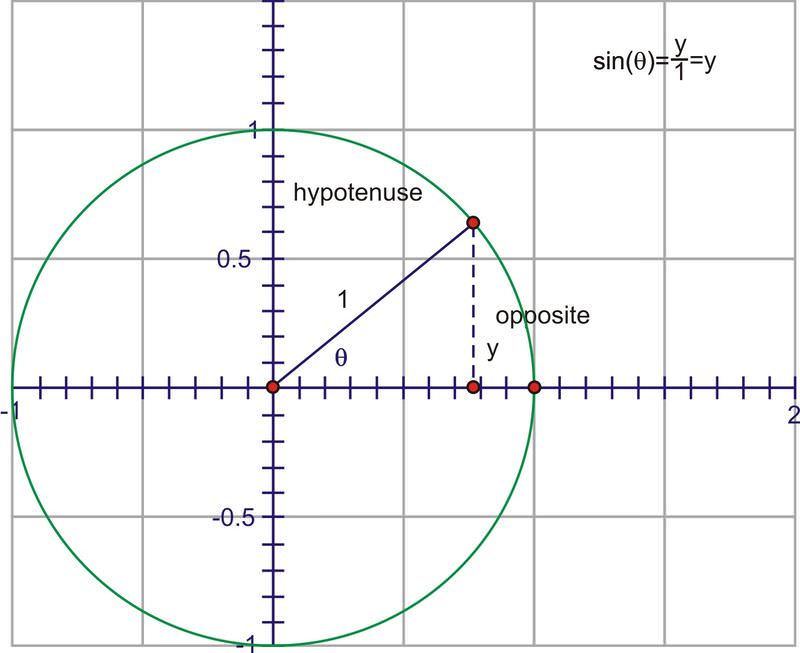
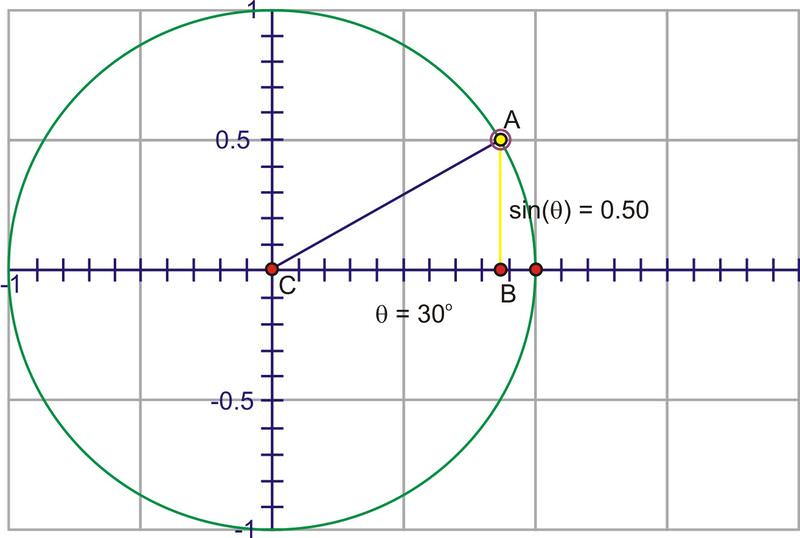
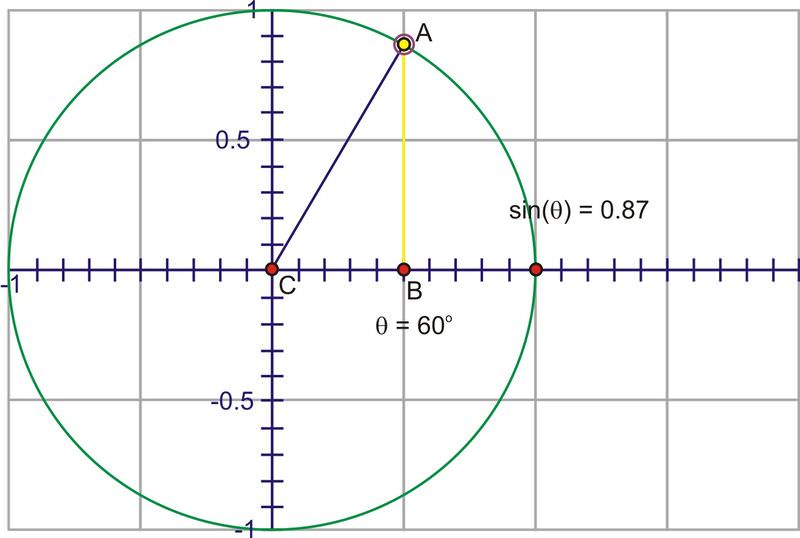
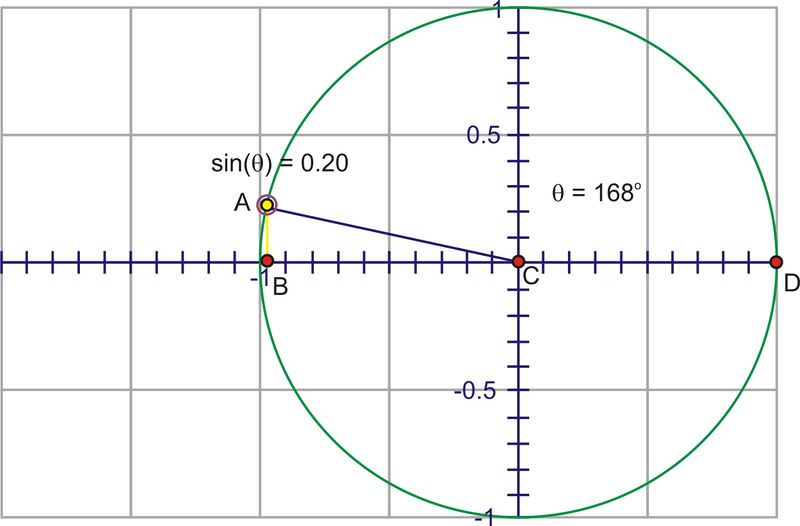
The denominator is now 1, so we have the simpler expression, \(\sin x=y\). The advantage to this is that we can use the y−coordinate of the point on the unit circle to trace the value of \(\sin \theta \) through a complete rotation. Imagine if we start at 0 and then rotate counter-clockwise through gradually increasing angles. Since the y−coordinate is the sine value, watch the height of the point as you rotate.
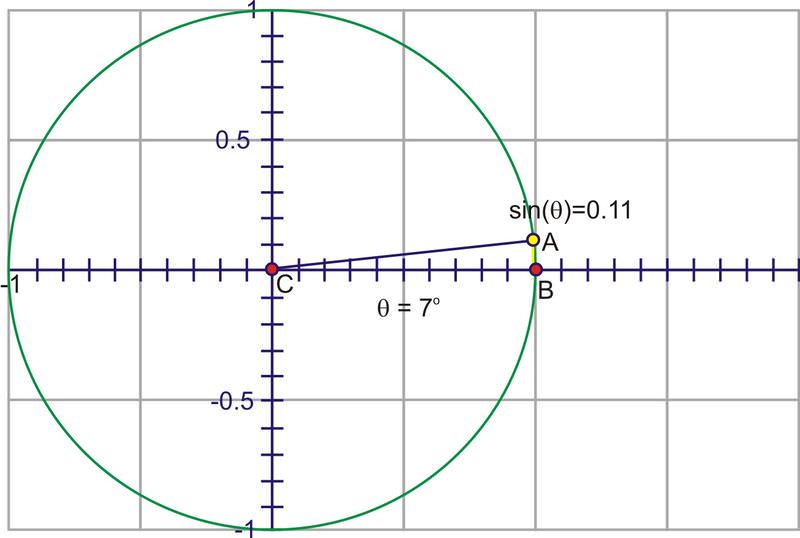
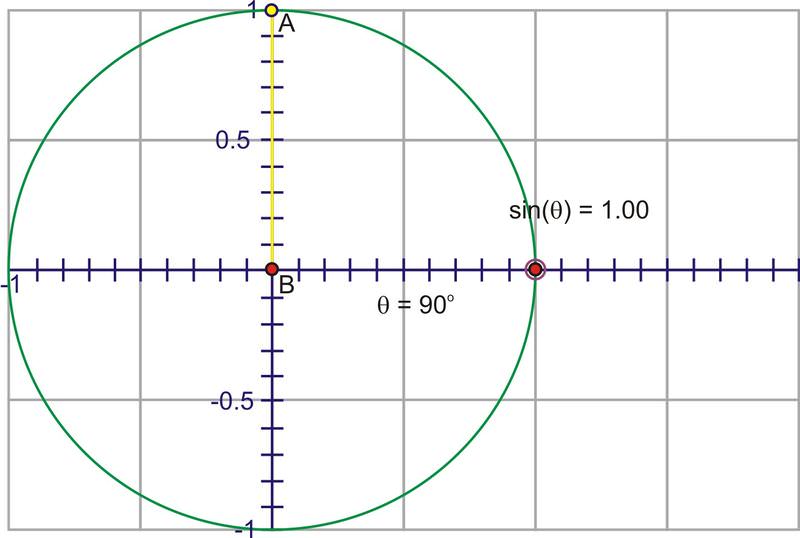
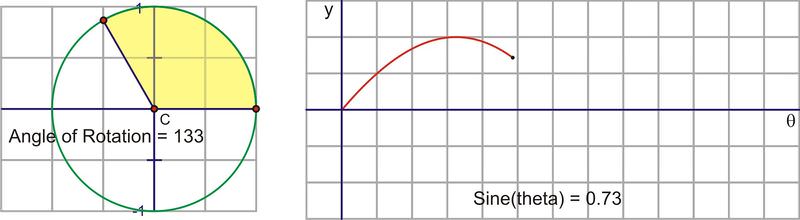
Through Quadrant I that height gets larger, starting at 0, increasing quickly at first, then slower until the angle reaches \(90^{\circ}\), at which point, the height is at its maximum value, 1.
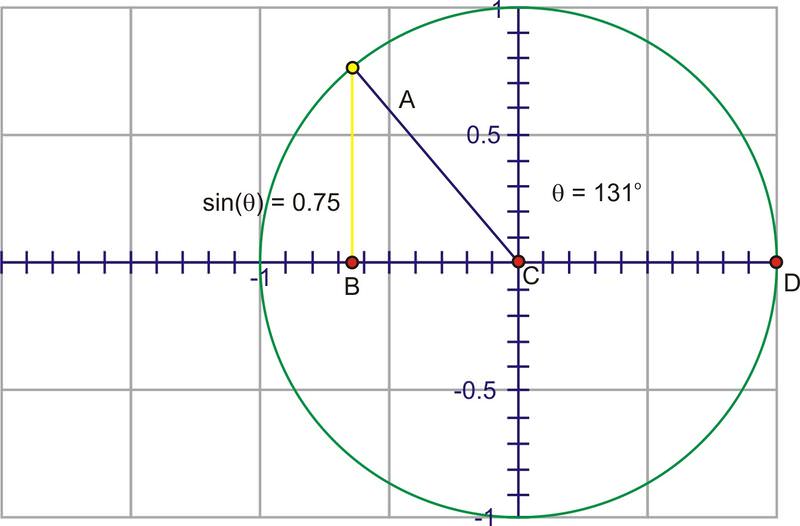
As you rotate into the second quadrant, the height starts to decrease towards zero.
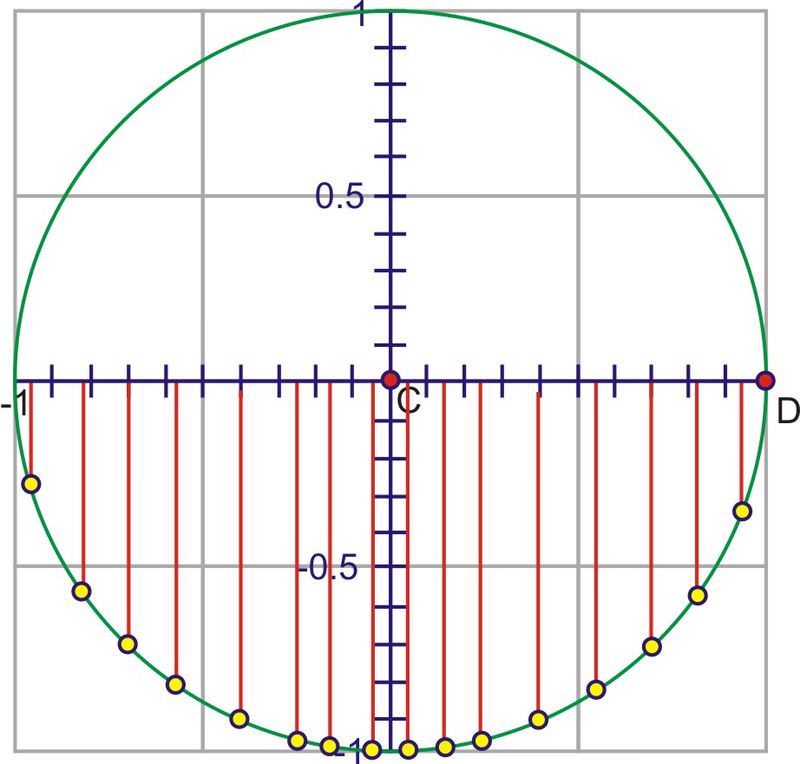
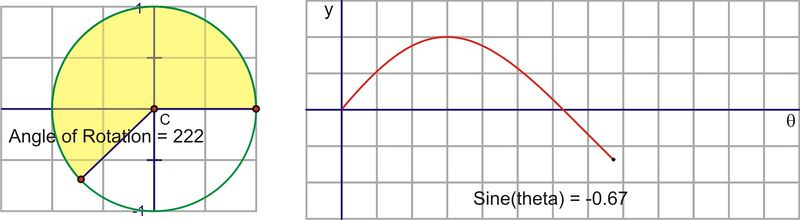
When you start to rotate into the third and fourth quadrants, the length of the segment increases, but this time in a negative direction, growing to -1 at \(270^{\circ}\) and heading back toward 0 at \(360^{\circ}\).
After one complete rotation, even though the angle continues to increase, the sine values will repeat themselves. The same would have been true if we chose to rotate clockwise to investigate negative angles, and this is why the sine function is a periodic function. The period is \(2\pi \) because that is the angle measure before the sine of the angle will repeat its values.
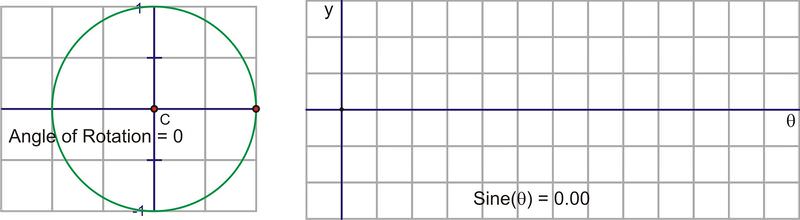
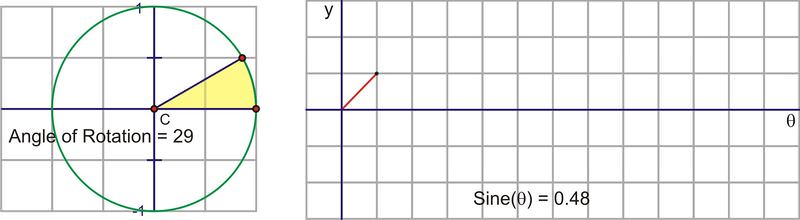
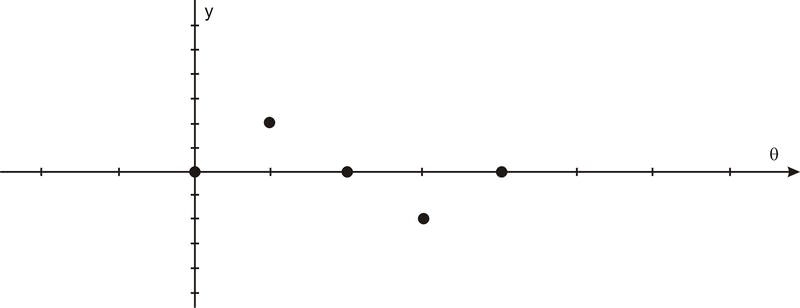
Let’s translate this circular motion into a graph of the sine value vs. the angle of rotation. The following sequence of pictures demonstrates the connection. These pictures plot \((\theta, \sin \theta )\) on the coordinate plane as \((x,y)\).
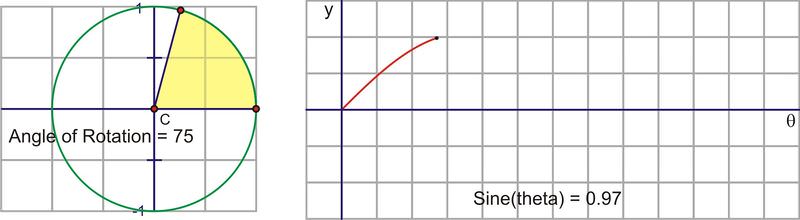
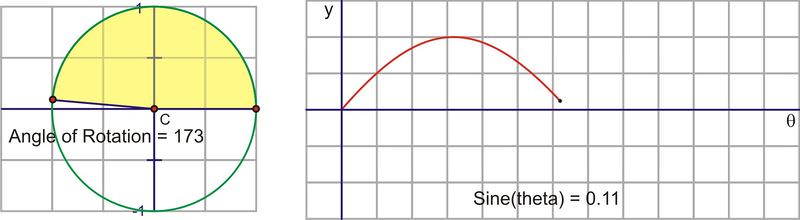
After we rotate around the circle once, the values start repeating. Therefore, the sine curve, or “wave,” also continues to repeat. The easiest way to sketch a sine curve is to plot the points for the quadrant angles. The value of \(\sin \theta \) goes from 0 to 1 to 0 to -1 and back to 0. Graphed along a horizontal axis, it would look like this:
Filling in the gaps in between and allowing for multiple rotations as well as negative angles results in the graph of \(y=\sin x\) where \(x\) is any angle of rotation, in radians.
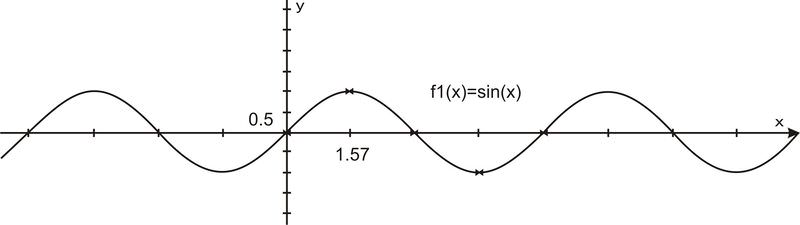
As we have already mentioned, \(\sin x\) has a period of \(2\pi \). You should also note that the y−values never go above 1 or below -1, so the range of a sine curve is \(\{−1\leq y\leq 1\}\). Because angles can be any value and will continue to rotate around the circle infinitely, there is no restriction on the angle \(x\), so the domain of \(\sin x\) is all reals.
Cosecant is the reciprocal of sine, or 1y. Therefore, whenever the sine is zero, the cosecant is going to have a vertical asymptote because it will be undefined. It also has the same sign as the sine function in the same quadrants. Here is the graph.
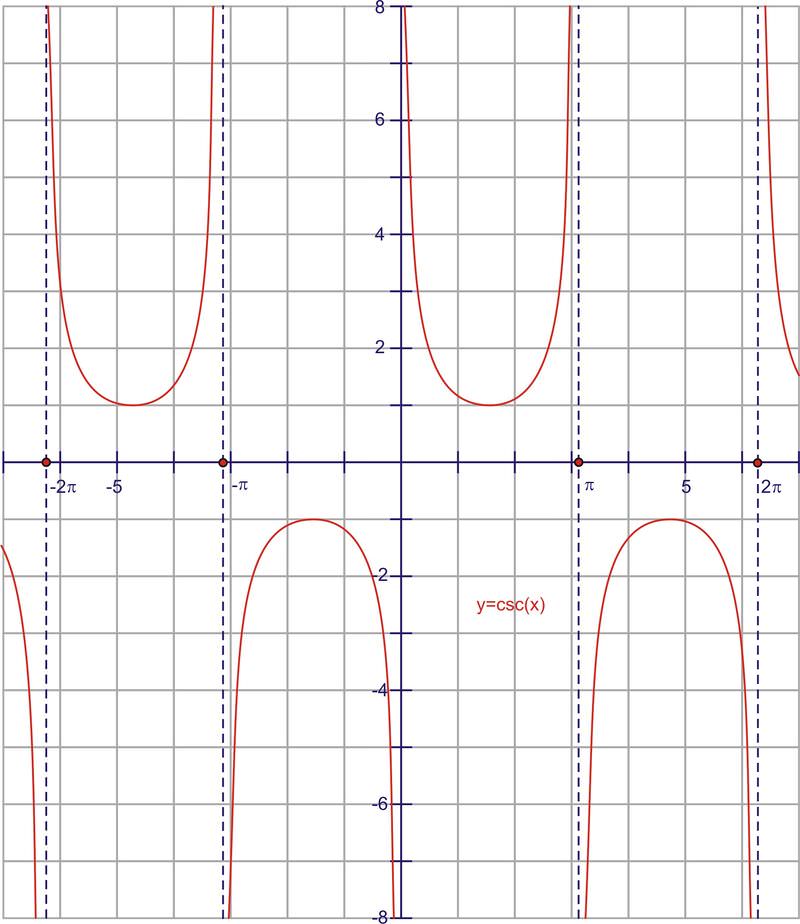
The period of the function is \(2\pi \), just like sine. The domain of the function is all real numbers, except multiples of \(\pi \left\{\ldots−2\pi ,−\pi ,0,\pi ,2\pi \ldots \right\}\). The range is all real numbers greater than or equal to 1, as well as all real numbers less than or equal to -1. Notice that the range is everything except where sine is defined (other than the points at the top and bottom of the sine curve
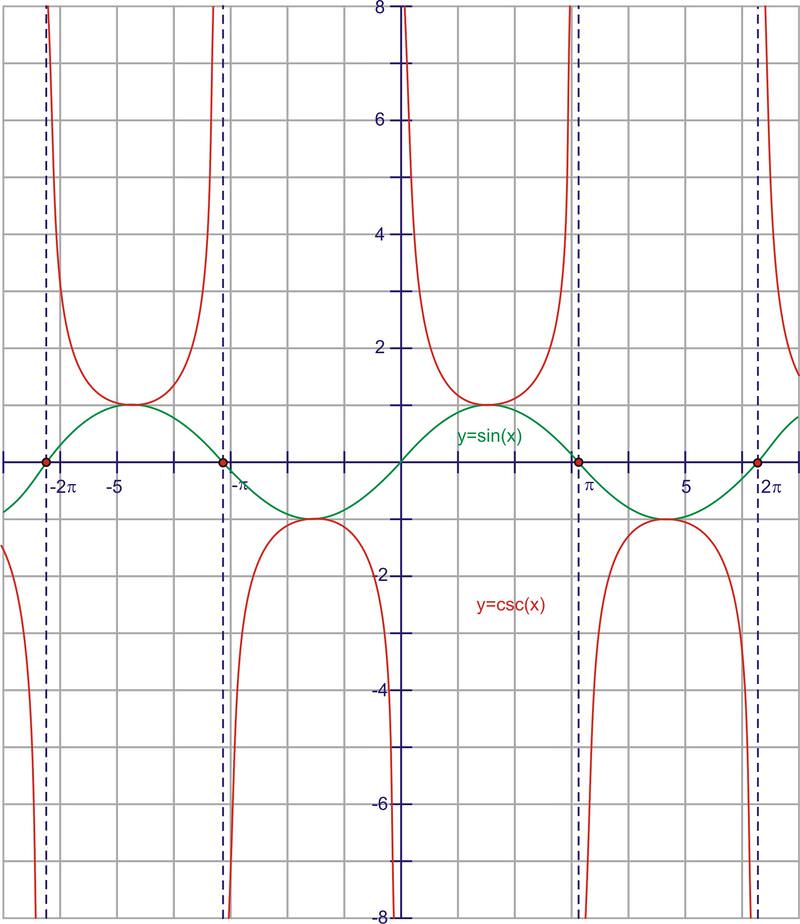
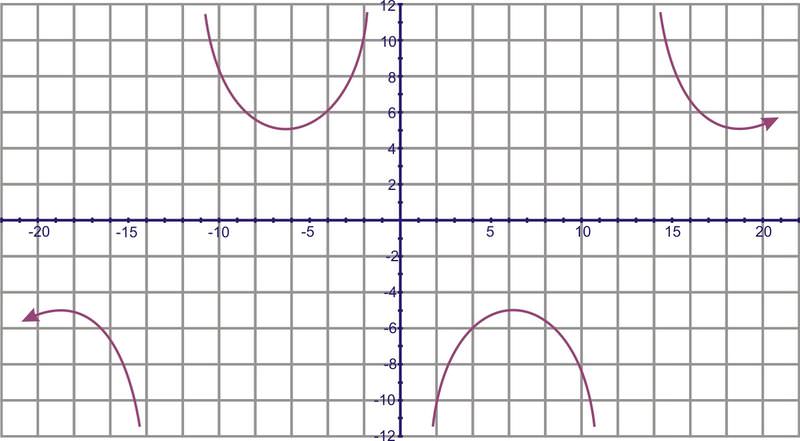
Notice again the reciprocal relationships at 0 and the asymptotes. Also look at the intersection points of the graphs at 1 and -1. Many students are reminded of parabolas when they look at the half-period of the cosecant graph. While they are similar in that they each have a local minimum or maximum and they have the same beginning and ending behavior, the comparisons end there. Parabolas are not restricted by asymptotes, whereas the cosecant curve is.
Graphing Functions
Graph the following functions:
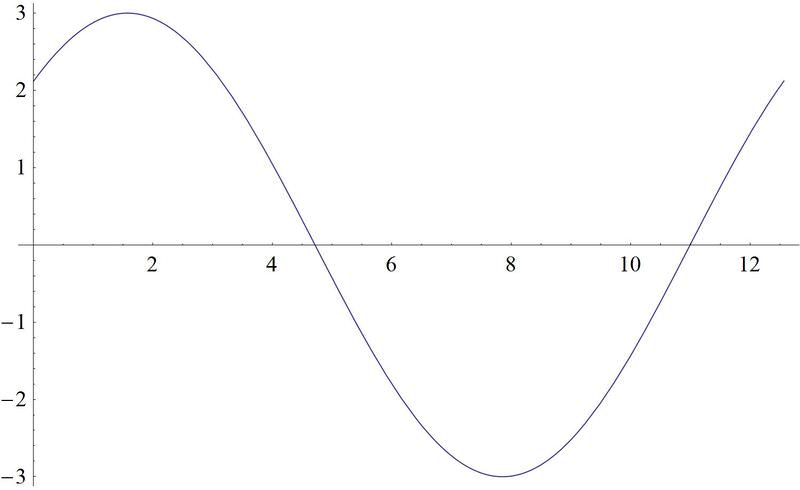
1. \(g(x)=\dfrac{1}{2}\sin (3x)\).
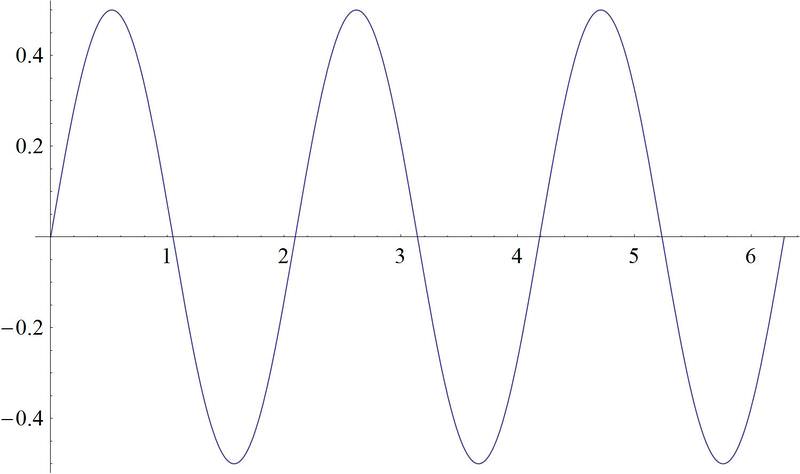
As you can see from the graph, the \(\dfrac{1}{2}\) in front of the function reduces the function's height, while the 3 inside the argument of the function makes the function "squished" along the "x" axis.
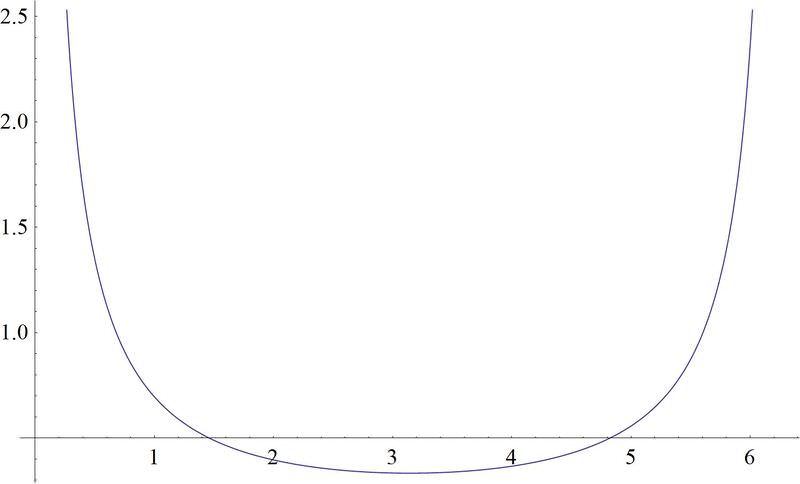
2. \(f(x)=\dfrac{1}{3} \csc\left(\dfrac{1}{2}x\right)\).
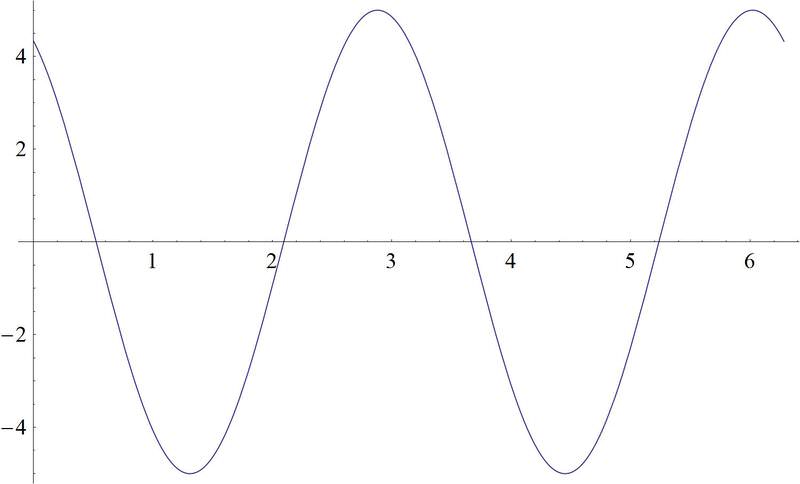
3. \(f(x)=5\sin \left(2\left(x+\dfrac{\pi }{3}\right)\right)\).
Earlier, you were asked what pattern the shadow would trace out.
Solution
As you have seen in this lesson, the shadow of a light applied vertically to a rotating clock hand would trace out a sine graph. The graph would begin at zero when the hand is lying flat along the positive "x" axis. It would then increase until the hand was vertical. It would then decrease until the rotating hand was pointing straight down. Finally, the graph would increase again to zero when the hand is returning to the positive "x" axis.
Graph \(g(x)=5\csc\left(\dfrac{1}{4}\left(x+\pi \right)\right)\).
Solution
Determine the function creating this graph:
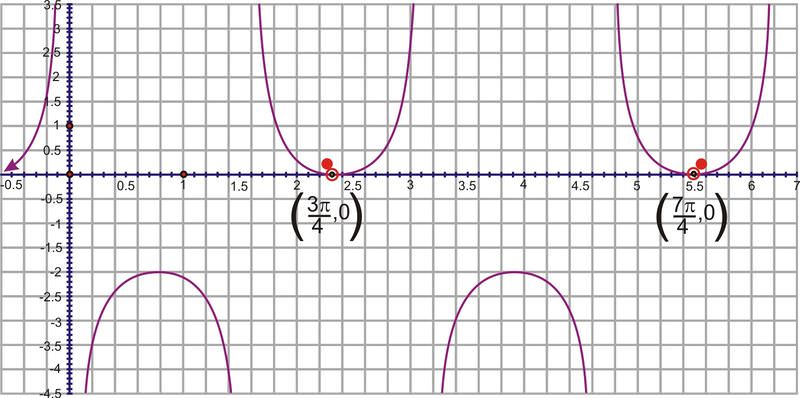
Solution
This could be either a secant or cosecant function. We will use a cosecant model. First, the vertical shift is -1. The period is the difference between the two given x−values, \(\dfrac{7 \pi}{4}−\dfrac{3 \pi}{4}=\pi \), so the frequency is \(\dfrac{2\pi }{\pi }=2\). The horizontal shift incorporates the frequency, so in \(y=\csc x\) the corresponding x−value to \(\left(\dfrac{3 \pi}{4},0\right)\) is \(\left(\dfrac{\pi }{2},1\right)\). The difference between the x−values is \(\dfrac{3 \pi}{4}−\dfrac{\pi }{2}=3\dfrac{\pi}{4}−\dfrac{2 \pi}{4}=\dfrac{\pi}{4}\) and then multiply it by the frequency, \(2\cdot \dfrac{\pi}{4}=\dfrac{\pi }{2}\). The equation is \(y=−1+\csc \left(2\left(x−\dfrac{\pi }{2}\right)\right)\).
Graph \(h(x)=3\sin \left(\dfrac{1}{2}\left(x+\dfrac{\pi }{2}\right)\right)\).
Solution
Review
Graph each of the following functions.
- \(f(x)=\sin (x)\).
- \(h(x)=\sin (2x)\).
- \(k(x)=\sin (2x+\pi )\).
- \(m(x)=2\sin (2x+\pi )\).
- \(g(x)=2\sin (2x+\pi )+2\).
- \(f(x)=\csc(x)\).
- \(h(x)=\csc(2x)\).
- \(k(x)=\csc(2x+\pi )\).
- \(m(x)=2\csc(2x+\pi )\).
- \(g(x)=2\csc(2x+\pi )+2\).
- \(h(x)=\sin (3x)\).
- \(k(x)=\sin \left(3x+\dfrac{\pi }{2}\right)\).
- \(m(x)=3\sin \left(3x+\dfrac{\pi }{2}\right)\).
- \(g(x)=3\sin \left(3x+\dfrac{\pi }{2}\right)+3\).
- \(h(x)=\csc(3x)\)
- \(k(x)=\csc\left(3x+\dfrac{3 \pi }{2}\right)\).
- \(m(x)=4\csc\left(3x+\dfrac{3 \pi }{2}\right)\).
- \(g(x)=4\csc\left(3x+\dfrac{3 \pi }{2}\right)−3\).
Review (Answers)
To see the Review answers, open this PDF file and look for section 2.9.
Vocabulary
| Term | Definition |
|---|---|
| Circular Function | A circular function is a function measured by examining the angle of rotation around the coordinate plane. |
Additional Resources
Video: Animation: Graphing the Sine Function U\sin g the Unit Circle