
3.7: The Economics of Government Spending
- Page ID
- 6911
\( \newcommand{\vecs}[1]{\overset { \scriptstyle \rightharpoonup} {\mathbf{#1}} } \)
\( \newcommand{\vecd}[1]{\overset{-\!-\!\rightharpoonup}{\vphantom{a}\smash {#1}}} \)
\( \newcommand{\dsum}{\displaystyle\sum\limits} \)
\( \newcommand{\dint}{\displaystyle\int\limits} \)
\( \newcommand{\dlim}{\displaystyle\lim\limits} \)
\( \newcommand{\id}{\mathrm{id}}\) \( \newcommand{\Span}{\mathrm{span}}\)
( \newcommand{\kernel}{\mathrm{null}\,}\) \( \newcommand{\range}{\mathrm{range}\,}\)
\( \newcommand{\RealPart}{\mathrm{Re}}\) \( \newcommand{\ImaginaryPart}{\mathrm{Im}}\)
\( \newcommand{\Argument}{\mathrm{Arg}}\) \( \newcommand{\norm}[1]{\| #1 \|}\)
\( \newcommand{\inner}[2]{\langle #1, #2 \rangle}\)
\( \newcommand{\Span}{\mathrm{span}}\)
\( \newcommand{\id}{\mathrm{id}}\)
\( \newcommand{\Span}{\mathrm{span}}\)
\( \newcommand{\kernel}{\mathrm{null}\,}\)
\( \newcommand{\range}{\mathrm{range}\,}\)
\( \newcommand{\RealPart}{\mathrm{Re}}\)
\( \newcommand{\ImaginaryPart}{\mathrm{Im}}\)
\( \newcommand{\Argument}{\mathrm{Arg}}\)
\( \newcommand{\norm}[1]{\| #1 \|}\)
\( \newcommand{\inner}[2]{\langle #1, #2 \rangle}\)
\( \newcommand{\Span}{\mathrm{span}}\) \( \newcommand{\AA}{\unicode[.8,0]{x212B}}\)
\( \newcommand{\vectorA}[1]{\vec{#1}} % arrow\)
\( \newcommand{\vectorAt}[1]{\vec{\text{#1}}} % arrow\)
\( \newcommand{\vectorB}[1]{\overset { \scriptstyle \rightharpoonup} {\mathbf{#1}} } \)
\( \newcommand{\vectorC}[1]{\textbf{#1}} \)
\( \newcommand{\vectorD}[1]{\overrightarrow{#1}} \)
\( \newcommand{\vectorDt}[1]{\overrightarrow{\text{#1}}} \)
\( \newcommand{\vectE}[1]{\overset{-\!-\!\rightharpoonup}{\vphantom{a}\smash{\mathbf {#1}}}} \)
\( \newcommand{\vecs}[1]{\overset { \scriptstyle \rightharpoonup} {\mathbf{#1}} } \)
\(\newcommand{\longvect}{\overrightarrow}\)
\( \newcommand{\vecd}[1]{\overset{-\!-\!\rightharpoonup}{\vphantom{a}\smash {#1}}} \)
\(\newcommand{\avec}{\mathbf a}\) \(\newcommand{\bvec}{\mathbf b}\) \(\newcommand{\cvec}{\mathbf c}\) \(\newcommand{\dvec}{\mathbf d}\) \(\newcommand{\dtil}{\widetilde{\mathbf d}}\) \(\newcommand{\evec}{\mathbf e}\) \(\newcommand{\fvec}{\mathbf f}\) \(\newcommand{\nvec}{\mathbf n}\) \(\newcommand{\pvec}{\mathbf p}\) \(\newcommand{\qvec}{\mathbf q}\) \(\newcommand{\svec}{\mathbf s}\) \(\newcommand{\tvec}{\mathbf t}\) \(\newcommand{\uvec}{\mathbf u}\) \(\newcommand{\vvec}{\mathbf v}\) \(\newcommand{\wvec}{\mathbf w}\) \(\newcommand{\xvec}{\mathbf x}\) \(\newcommand{\yvec}{\mathbf y}\) \(\newcommand{\zvec}{\mathbf z}\) \(\newcommand{\rvec}{\mathbf r}\) \(\newcommand{\mvec}{\mathbf m}\) \(\newcommand{\zerovec}{\mathbf 0}\) \(\newcommand{\onevec}{\mathbf 1}\) \(\newcommand{\real}{\mathbb R}\) \(\newcommand{\twovec}[2]{\left[\begin{array}{r}#1 \\ #2 \end{array}\right]}\) \(\newcommand{\ctwovec}[2]{\left[\begin{array}{c}#1 \\ #2 \end{array}\right]}\) \(\newcommand{\threevec}[3]{\left[\begin{array}{r}#1 \\ #2 \\ #3 \end{array}\right]}\) \(\newcommand{\cthreevec}[3]{\left[\begin{array}{c}#1 \\ #2 \\ #3 \end{array}\right]}\) \(\newcommand{\fourvec}[4]{\left[\begin{array}{r}#1 \\ #2 \\ #3 \\ #4 \end{array}\right]}\) \(\newcommand{\cfourvec}[4]{\left[\begin{array}{c}#1 \\ #2 \\ #3 \\ #4 \end{array}\right]}\) \(\newcommand{\fivevec}[5]{\left[\begin{array}{r}#1 \\ #2 \\ #3 \\ #4 \\ #5 \\ \end{array}\right]}\) \(\newcommand{\cfivevec}[5]{\left[\begin{array}{c}#1 \\ #2 \\ #3 \\ #4 \\ #5 \\ \end{array}\right]}\) \(\newcommand{\mattwo}[4]{\left[\begin{array}{rr}#1 \amp #2 \\ #3 \amp #4 \\ \end{array}\right]}\) \(\newcommand{\laspan}[1]{\text{Span}\{#1\}}\) \(\newcommand{\bcal}{\cal B}\) \(\newcommand{\ccal}{\cal C}\) \(\newcommand{\scal}{\cal S}\) \(\newcommand{\wcal}{\cal W}\) \(\newcommand{\ecal}{\cal E}\) \(\newcommand{\coords}[2]{\left\{#1\right\}_{#2}}\) \(\newcommand{\gray}[1]{\color{gray}{#1}}\) \(\newcommand{\lgray}[1]{\color{lightgray}{#1}}\) \(\newcommand{\rank}{\operatorname{rank}}\) \(\newcommand{\row}{\text{Row}}\) \(\newcommand{\col}{\text{Col}}\) \(\renewcommand{\row}{\text{Row}}\) \(\newcommand{\nul}{\text{Nul}}\) \(\newcommand{\var}{\text{Var}}\) \(\newcommand{\corr}{\text{corr}}\) \(\newcommand{\len}[1]{\left|#1\right|}\) \(\newcommand{\bbar}{\overline{\bvec}}\) \(\newcommand{\bhat}{\widehat{\bvec}}\) \(\newcommand{\bperp}{\bvec^\perp}\) \(\newcommand{\xhat}{\widehat{\xvec}}\) \(\newcommand{\vhat}{\widehat{\vvec}}\) \(\newcommand{\uhat}{\widehat{\uvec}}\) \(\newcommand{\what}{\widehat{\wvec}}\) \(\newcommand{\Sighat}{\widehat{\Sigma}}\) \(\newcommand{\lt}{<}\) \(\newcommand{\gt}{>}\) \(\newcommand{\amp}{&}\) \(\definecolor{fillinmathshade}{gray}{0.9}\)The Economics of Government Spending
Government spending covers a range of services provided by the federal, state, and local governments. When the federal government spends more money than it receives in taxes in a given year, it runs a budget deficit. Conversely, when the government receives more money in taxes than it spends in a year, it runs a budget surplus. If government spending and taxes are equal, it is said to have a balanced budget. For example, in 2009, the U.S. government experienced its largest budget deficit ever as the federal government spent $1.4 trillion more than it collected in taxes. This deficit was about 10% of the size of the U.S. GDP in 2009, making it by far the largest budget deficit relative to GDP since the mammoth borrowing used to finance World War II.
Universal Generalizations
- Government economic policies at all levels influence levels of employment, output, and price levels.
- The role of the federal government has grown making it a vital player in the economy.
Guiding Questions
- Why has the federal government’s role in the national economy grown over the last 100 years?
- Has the national government helped or hindered the nation’s economic growth since the 1940s?
- How have current economic goals of the government impacted government spending?
Introduction to Government Budgets and Fiscal Policy
Video: Government Shutdown: Locked Out of "Lady Liberty"
No Yellowstone Park?
So you had trekked all the way to see Yellowstone National Park in the beautiful month of October 2013, only to find it… closed. Closed! Why?
For two weeks in October 2013, the U.S. federal government shut down. Many federal services, like the national parks, closed and 800,000 federal employees were furloughed. Tourists were shocked, so was the rest of the world: Congress and the President could not agree on a budget. Inside the Capitol, Republicans and Democrats argued about spending priorities and whether to increase the national debt limit. Each year's budget, which is over $3 trillion of spending, must be approved by Congress and signed by the President. Two-thirds of the budget is entitlements and other mandatory spending which occur without congressional or presidential action once the programs are set up. Tied to the budget debate was the issue of increasing the debt ceiling—how high the national debt of the U.S. government can be. The House of Representatives refused to sign on to the bills to fund the government unless they included provisions to stop or change the Affordable Health Care Act (more colloquially known as Obamacare). As the days ticked by, the United States came very close to defaulting on its debt.
Why does the federal budget create such intense debates? What would happen if the United States actually defaulted on its debt? In this chapter, we will examine the federal budget, taxation, and fiscal policy. We will also look at the annual federal budget deficits and the national debt.
All levels of government—federal, state, and local—have budgets that show how much revenue the government expects to receive in taxes and other income and how the government plans to spend it. Budgets, however, can shift dramatically within a few years, as policy decisions and unexpected events shake up earlier tax and spending plans.
Fiscal policy is one of two policy tools for fine-tuning the economy (the other is monetary policy). While monetary policy is made by policymakers at the Federal Reserve, fiscal policy is made by Congress and the President.
The discussion of fiscal policy focuses on how federal government taxing and spending affects aggregate demand. All government spending and taxes affect the economy, but fiscal policy focuses strictly on the policies of the federal government. We begin with an overview of U.S. government spending and taxes. We then discuss fiscal policy from a short run perspective; that is, how the government uses tax and spending policies to address recession, unemployment, and inflation; how periods of recession and growth affect government budgets; and the merits of balanced budget proposals.
Total U.S. Government Spending
Federal spending in nominal dollars (that is, dollars not adjusted for inflation) has grown by a multiple of more than 38 over the last four decades, from $92 billion in 1960 to $3.6 trillion in 2012. Comparing spending over time in nominal dollars is misleading because it does not take into account inflation or growth in population and the real economy. A more useful method of comparison is to examine government spending as a percent of GDP over time.
The top line in Figure 1 shows the level of federal spending since 1960, expressed as a share of GDP. Despite a widespread sense among many Americans that the federal government has been growing steadily larger, the graph shows that federal spending has hovered in a range from 18% to 22% of GDP most of the time since 1960. The other lines in Figure 1 show the major federal spending categories: national defense, Social Security, health programs, and interest payments. From the graph, we see that national defense spending as a share of GDP has generally declined since the 1960s, although there were some upward bumps in the 1980s buildup under President Ronald Reagan and in the aftermath of the terrorist attacks on September 11, 2001. In contrast, Social Security and healthcare have grown steadily as a percent of GDP. Healthcare expenditures include both payments for senior citizens (Medicare), and payments for low-income Americans (Medicaid). Medicaid is also partially funded by state governments. Interest payments are the final main category of government spending shown in the figure.
Federal Spending, 1960–2010
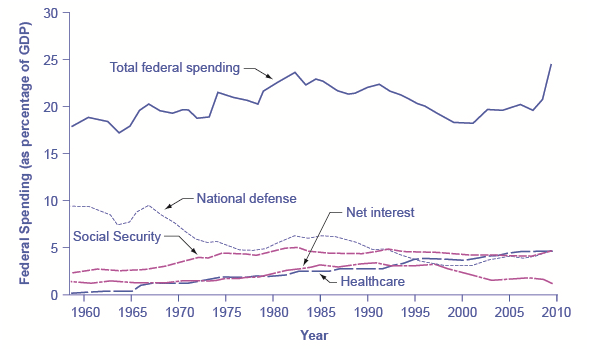
Since 1960, total federal spending has ranged from about 18% to 22% of GDP, although it climbed above that level in 2009. The share spent on national defense has generally declined, while the share spent on Social Security and on healthcare expenses (mainly Medicare and Medicaid) has increased. (Source: Economic Report of the President, Tables B-80 and B-1, http://www.gpo.gov/fdsys/pkg/ERP-201...nt-detail.html)
Each year, the government borrows funds from U.S. citizens and foreigners to cover its budget deficits. It does this by selling securities (Treasury bonds, notes, and bills)—in essence borrowing from the public and promising to repay with interest in the future. From 1961 to 1997, the U.S. government has run budget deficits, and thus borrowed funds, in almost every year. It had budget surpluses from 1998 to 2001, and then returned to deficits.
The interest payments on past federal government borrowing were typically 1–2% of GDP in the 1960s and 1970s but then climbed above 3% of GDP in the 1980s and stayed there until the late 1990s. The government was able to repay some of its past borrowing by running surpluses from 1998 to 2001 and, with help from low interest rates, the interest payments on past federal government borrowing had fallen back to 1.4% of GDP by 2012.
We investigate the patterns of government borrowing and debt in more detail later in this unit, but first we need to clarify the difference between the deficit and the debt. The deficit is not the debt. The difference between the deficit and the debt lies in the time frame. The government deficit (or surplus) refers to what happens with the federal government budget each year. The government debt is accumulated over time; it is the sum of all past deficits and surpluses. If you borrow $10,000 per year for each of the four years of college, you might say that your annual deficit was $10,000, but your accumulated debt over the four years is $40,000.
 The U.S. Army 1st Armored Division conducts training operations at Fort Bliss, Texas.
These four categories—national defense, Social Security, healthcare, and interest payments—account for roughly 71% of all federal spending, as Figure 3 shows. The remaining 29% wedge of the pie chart covers all other categories of federal government spending: international affairs; science and technology; natural resources and the environment; transportation; housing; education; income support for the poor; community and regional development; law enforcement and the judicial system; and the administrative costs of running the government.
Slices of Federal Spending, 2012
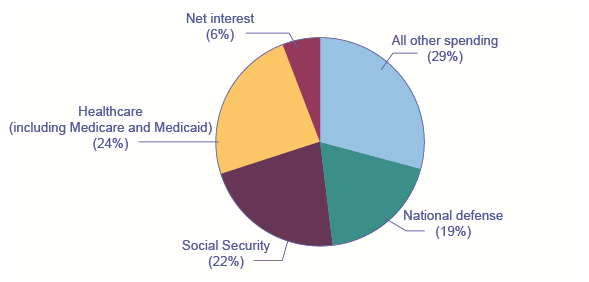
About 71% of government spending goes to four major areas: national defense, Social Security, healthcare, and interest payments on past borrowing. This leaves about 29% of federal spending for all other functions of the U.S. government. (Source: Economic Report of the President, Table B-80, http://www.gpo.gov/fdsys/pkg/ERP-2013/content-detail.html)
In 2015 the total government expenditures, by all levels of government was $6.2 trillion. On a per capita, or per person basis that would have been $19,386 / person. The pie chart shows the total spending, or the percentage of spending by categories, for the US in fiscal year 2015.
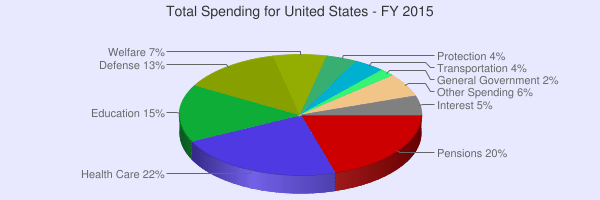
http://www.usgovernmentspending.com/united_states_total_spending_pie_chart
Government spending is often described as spending in the "public sector" or the part of the economy that is made up of the federal, state, and local governments. Economists agree that government spending began to grow significantly during the Great Depression (1929-1939), and then grew exponentially during World War II. The economic crisis of the Great Depression and the programs instituted by Franklin D. Roosevelt, changed public opinion about what the government's role should be in everyday economic affairs. The success of the New Deal programs to provide relief, recovery, and reform for Americans, set the stage for the unprecedented growth in government spending. Over the years, many Americans have accepted the expansion of government spending as part of the increase in government regulation of the free market economy and the development of social programs since 1932.
What the government does not provide, the private sector, or the part of the economy made up of private individuals and privately owned businesses, provides. So the economy is either categorized as either the public sector (government) or the private sector (not government).
Types of Spending
Spending is also termed expenditures, and the government spends money in the form of purchasing goods and services or as transfer payments. The government is a significant "consumer" in the private sector. It purchases vast amounts of goods to be used by its employees in its office such as computers, paper, copy machines or tables. It buys equipment for schools and universities, for the military and even for various departments that the government has created such as the Department of the Interior or the Department of Transportation. The government also provides services to the public by spending money to hire workers that staff the various departments, agencies, and the military.
Transfer payments are another form of expenditure. Transfer payments are paid out to certain individuals, such as those who receive Social Security, disability for military service, welfare, or unemployment compensation. The government does not receive a good or service for these payments, however, the money that the government provides to these recipients makes it possible for them to participate in the economy.
Another type of transfer payment is known as a "grant in aid" where one level of government transfers money to another level of government. The federal government grants money to the states and local governments for specific purposes such as road construction, education, and urban renewal. The money generally has "strings attached" which means that it can only be spent for the reason that it was given and that recipient must follow the rules for how it is to be spent. If the money is not spent correctly, the money must be repaid to the federal government.
The size of the expenditures from "public sector" has an enormous impact on the allocation of resources. When the government spends money it impacts both state and local economies. If the government decides to fund a particular state program or local agency it can bring jobs and growth to that area, however, the opposite is also true. If the government cuts a program or ends funding for a project it may increase unemployment or impact a local economy.
Another way that funding impacts the economy is the distribution of income. When the government increases or decreases transfer payments, it directly impacts those who receive those payments. If the government decides to spend money on defense and the military, then it can shift which part of the economy will benefit. In addition, the government can help a particular group that may be in need, such as farmers.
Finally, some economists believe that the government can compete with the private sector when it provides goods and services. For example, public schools and universities compete with private educational facilities; or veteran's hospitals have the same health services that public hospitals provide.
 Answer the self check questions below to monitor your understanding of the concepts in this section.
Self Check Questions
- Explain the term "public sector."
- Explain the term "private sector"
- What is a transfer payment? What is the purpose of a transfer payment?
- Explain the term "grant in aid" and give an example of it.
- Federal government spending can impact local governments. Recently, the federal government has closed some military bases and reduced the size of the standing military. Go online and research the positive and negative aspects of federal spending on the El Paso economy and give examples.
| Image | Reference | Attributions |
|
[Figure 1] | Credit: Pavel Špindler;U.S. Army Environmental Command;modification of work by “daveynin”/flickr Creative Commons Source: https://commons.wikimedia.org/wiki/File:Ji%C5%BEn%C3%AD_vstup_do_Yellowstone_N.P._-_panoramio.jpg ; https://farm4.staticflickr.com/3537/3551019855_71cbbd5df2_o.jpg ; www.usgovernmentspending.com/united_states_total_spending_pie_char License: CC-BY;CC BY-NC 3.0 |
 |
[Figure 2] | Credit: U.S. Army Environmental Command Source: https://farm4.staticflickr.com/3537/3551019855_71cbbd5df2_o.jpg License: CC BY-NC 3.0 |
|
[Figure 3] | Credit: Pavel Špindler;U.S. Army Environmental Command;modification of work by “daveynin”/flickr Creative Commons Source: https://commons.wikimedia.org/wiki/File:Ji%C5%BEn%C3%AD_vstup_do_Yellowstone_N.P._-_panoramio.jpg ; https://farm4.staticflickr.com/3537/3551019855_71cbbd5df2_o.jpg ; www.usgovernmentspending.com/united_states_total_spending_pie_char License: CC-BY;CC BY-NC 3.0 |
|
[Figure 4] | Credit: Pavel Špindler;U.S. Army Environmental Command Source: https://commons.wikimedia.org/wiki/File:Ji%C5%BEn%C3%AD_vstup_do_Yellowstone_N.P._-_panoramio.jpg ; https://farm4.staticflickr.com/3537/3551019855_71cbbd5df2_o.jpg ; www.usgovernmentspending.com/united_states_total_spending_pie_char License: CC-BY;CC BY-NC 3.0 |