
3.12: Inflation
- Page ID
- 1697
\( \newcommand{\vecs}[1]{\overset { \scriptstyle \rightharpoonup} {\mathbf{#1}} } \)
\( \newcommand{\vecd}[1]{\overset{-\!-\!\rightharpoonup}{\vphantom{a}\smash {#1}}} \)
\( \newcommand{\dsum}{\displaystyle\sum\limits} \)
\( \newcommand{\dint}{\displaystyle\int\limits} \)
\( \newcommand{\dlim}{\displaystyle\lim\limits} \)
\( \newcommand{\id}{\mathrm{id}}\) \( \newcommand{\Span}{\mathrm{span}}\)
( \newcommand{\kernel}{\mathrm{null}\,}\) \( \newcommand{\range}{\mathrm{range}\,}\)
\( \newcommand{\RealPart}{\mathrm{Re}}\) \( \newcommand{\ImaginaryPart}{\mathrm{Im}}\)
\( \newcommand{\Argument}{\mathrm{Arg}}\) \( \newcommand{\norm}[1]{\| #1 \|}\)
\( \newcommand{\inner}[2]{\langle #1, #2 \rangle}\)
\( \newcommand{\Span}{\mathrm{span}}\)
\( \newcommand{\id}{\mathrm{id}}\)
\( \newcommand{\Span}{\mathrm{span}}\)
\( \newcommand{\kernel}{\mathrm{null}\,}\)
\( \newcommand{\range}{\mathrm{range}\,}\)
\( \newcommand{\RealPart}{\mathrm{Re}}\)
\( \newcommand{\ImaginaryPart}{\mathrm{Im}}\)
\( \newcommand{\Argument}{\mathrm{Arg}}\)
\( \newcommand{\norm}[1]{\| #1 \|}\)
\( \newcommand{\inner}[2]{\langle #1, #2 \rangle}\)
\( \newcommand{\Span}{\mathrm{span}}\) \( \newcommand{\AA}{\unicode[.8,0]{x212B}}\)
\( \newcommand{\vectorA}[1]{\vec{#1}} % arrow\)
\( \newcommand{\vectorAt}[1]{\vec{\text{#1}}} % arrow\)
\( \newcommand{\vectorB}[1]{\overset { \scriptstyle \rightharpoonup} {\mathbf{#1}} } \)
\( \newcommand{\vectorC}[1]{\textbf{#1}} \)
\( \newcommand{\vectorD}[1]{\overrightarrow{#1}} \)
\( \newcommand{\vectorDt}[1]{\overrightarrow{\text{#1}}} \)
\( \newcommand{\vectE}[1]{\overset{-\!-\!\rightharpoonup}{\vphantom{a}\smash{\mathbf {#1}}}} \)
\( \newcommand{\vecs}[1]{\overset { \scriptstyle \rightharpoonup} {\mathbf{#1}} } \)
\(\newcommand{\longvect}{\overrightarrow}\)
\( \newcommand{\vecd}[1]{\overset{-\!-\!\rightharpoonup}{\vphantom{a}\smash {#1}}} \)
\(\newcommand{\avec}{\mathbf a}\) \(\newcommand{\bvec}{\mathbf b}\) \(\newcommand{\cvec}{\mathbf c}\) \(\newcommand{\dvec}{\mathbf d}\) \(\newcommand{\dtil}{\widetilde{\mathbf d}}\) \(\newcommand{\evec}{\mathbf e}\) \(\newcommand{\fvec}{\mathbf f}\) \(\newcommand{\nvec}{\mathbf n}\) \(\newcommand{\pvec}{\mathbf p}\) \(\newcommand{\qvec}{\mathbf q}\) \(\newcommand{\svec}{\mathbf s}\) \(\newcommand{\tvec}{\mathbf t}\) \(\newcommand{\uvec}{\mathbf u}\) \(\newcommand{\vvec}{\mathbf v}\) \(\newcommand{\wvec}{\mathbf w}\) \(\newcommand{\xvec}{\mathbf x}\) \(\newcommand{\yvec}{\mathbf y}\) \(\newcommand{\zvec}{\mathbf z}\) \(\newcommand{\rvec}{\mathbf r}\) \(\newcommand{\mvec}{\mathbf m}\) \(\newcommand{\zerovec}{\mathbf 0}\) \(\newcommand{\onevec}{\mathbf 1}\) \(\newcommand{\real}{\mathbb R}\) \(\newcommand{\twovec}[2]{\left[\begin{array}{r}#1 \\ #2 \end{array}\right]}\) \(\newcommand{\ctwovec}[2]{\left[\begin{array}{c}#1 \\ #2 \end{array}\right]}\) \(\newcommand{\threevec}[3]{\left[\begin{array}{r}#1 \\ #2 \\ #3 \end{array}\right]}\) \(\newcommand{\cthreevec}[3]{\left[\begin{array}{c}#1 \\ #2 \\ #3 \end{array}\right]}\) \(\newcommand{\fourvec}[4]{\left[\begin{array}{r}#1 \\ #2 \\ #3 \\ #4 \end{array}\right]}\) \(\newcommand{\cfourvec}[4]{\left[\begin{array}{c}#1 \\ #2 \\ #3 \\ #4 \end{array}\right]}\) \(\newcommand{\fivevec}[5]{\left[\begin{array}{r}#1 \\ #2 \\ #3 \\ #4 \\ #5 \\ \end{array}\right]}\) \(\newcommand{\cfivevec}[5]{\left[\begin{array}{c}#1 \\ #2 \\ #3 \\ #4 \\ #5 \\ \end{array}\right]}\) \(\newcommand{\mattwo}[4]{\left[\begin{array}{rr}#1 \amp #2 \\ #3 \amp #4 \\ \end{array}\right]}\) \(\newcommand{\laspan}[1]{\text{Span}\{#1\}}\) \(\newcommand{\bcal}{\cal B}\) \(\newcommand{\ccal}{\cal C}\) \(\newcommand{\scal}{\cal S}\) \(\newcommand{\wcal}{\cal W}\) \(\newcommand{\ecal}{\cal E}\) \(\newcommand{\coords}[2]{\left\{#1\right\}_{#2}}\) \(\newcommand{\gray}[1]{\color{gray}{#1}}\) \(\newcommand{\lgray}[1]{\color{lightgray}{#1}}\) \(\newcommand{\rank}{\operatorname{rank}}\) \(\newcommand{\row}{\text{Row}}\) \(\newcommand{\col}{\text{Col}}\) \(\renewcommand{\row}{\text{Row}}\) \(\newcommand{\nul}{\text{Nul}}\) \(\newcommand{\var}{\text{Var}}\) \(\newcommand{\corr}{\text{corr}}\) \(\newcommand{\len}[1]{\left|#1\right|}\) \(\newcommand{\bbar}{\overline{\bvec}}\) \(\newcommand{\bhat}{\widehat{\bvec}}\) \(\newcommand{\bperp}{\bvec^\perp}\) \(\newcommand{\xhat}{\widehat{\xvec}}\) \(\newcommand{\vhat}{\widehat{\vvec}}\) \(\newcommand{\uhat}{\widehat{\uvec}}\) \(\newcommand{\what}{\widehat{\wvec}}\) \(\newcommand{\Sighat}{\widehat{\Sigma}}\) \(\newcommand{\lt}{<}\) \(\newcommand{\gt}{>}\) \(\newcommand{\amp}{&}\) \(\definecolor{fillinmathshade}{gray}{0.9}\)Inflation
In the U.S. economy, the annual inflation rate in the last two decades has typically been around 2% to 4%. The periods of highest inflation in the United States in the twentieth century occurred during the years after World Wars I and II and in the 1970s. The period of lowest inflation—actually, with deflation—was the Great Depression of the 1930s.
Unexpected inflation will tend to hurt those whose money received, including wages and interest payments, does not rise with inflation. In contrast, inflation can help those who owe money that can be paid in less valuable, inflated dollars. Low rates of inflation have a relatively small economic impact over the short term. Over the medium and the long run, even low rates of inflation can complicate future planning. High rates of inflation can muddle price signals in the short term, prevent market forces from operating efficiently, and can vastly complicate long-term savings and investment decisions.
Universal Generalizations
- Inflation is a general rise in the level of prices.
- One reason for the concept of inflation is the "demand-pull" theory.
- Another reason for the concept of inflation is excessive monetary growth.
- When price levels decrease, the dollar buys more.
Guiding Questions
- How do economists determine inflation?
- What are two consequences of inflation?
- Why does inflation destabilize the economy?
Introduction to Inflation

This bill was worth 100 billion Zimbabwean dollars when issued in 2008. There were even bills issued with a face value of 100 trillion Zimbabwean dollars. The bills had $100,000,000,000,000 written on them. Unfortunately, they were almost worthless. At one point, 621,984,228 Zimbabwean dollars were equal to one U.S. dollar. Eventually, the country abandoned its currency and allowed the foreign currency to be used for purchases. (Credit: modification of work by Samantha Marx/Flickr Creative Commons)
Video: What Causes Inflation?
A $550 Million Loaf of Bread?
If you were born within the last three decades in the United States, Canada, or many other countries in the developed world, you probably have no real experience with a high rate of inflation. Inflation is when most prices in an entire economy are rising, but there is an extreme form of inflation called hyperinflation. Hyperinflation occurred in Germany between 1921 and 1928, and more recently in Zimbabwe between 2008 and 2009. In November of 2008, Zimbabwe had an inflation rate of 79.6 billion percent. In contrast, in 2012, the United States had an average annual rate of inflation of 2.1%.
Zimbabwe’s inflation rate was so high that it is difficult to comprehend, so let’s put it into context. It was equivalent to price increases of 98% per day; essentially, from one day to the next, prices essentially doubled. What is life like in an economy afflicted with hyperinflation? Prices for commodities in Zimbabwean dollars were adjusted several times each day. There was no desire to hold on to currency since it lost value by the minute. The people there spent a great deal of time getting rid of any cash they acquired by purchasing whatever food or other commodities they could find. At one point, a loaf of bread cost 550 million Zimbabwean dollars. Surprisingly, teachers were paid in the trillions a month; however, this was equivalent to only one U.S. dollar a day. At its height, it took 621,984,228 Zimbabwean dollars to purchase one U.S. dollar.
Government agencies had no money to pay their workers so they started printing money to pay their bills rather than raising taxes. Rising prices caused the government to enact price controls on private businesses, which led to shortages and the emergence of black markets. In 2009, the country abandoned its currency and allowed foreign currencies to be used for purchases.
How does this happen? How can both government and the economy fail to function at the most basic level? Before we consider these extreme cases of hyperinflation, let’s first look at inflation itself.
Inflation is a general and ongoing rise in the level of prices in an entire economy. Inflation does not refer to a change in relative prices. A relative price change occurs when you see that the price of tuition has risen, but the price of laptops has fallen. Inflation, on the other hand, means that there is pressure for prices to rise in most markets in the economy. In addition, price increases in the supply-and-demand model were one-time events, representing a shift from a previous equilibrium to a new one. Inflation implies an ongoing rise in prices. If inflation happened for one year and then stopped—well, then it would not be inflation anymore.
Degrees of Inflation
There are three basic terms used to describe inflation: creeping inflation, galloping inflation, and hyperinflation. Creeping inflation is calculated at between 1-3% per year. While creeping inflation is not immediately felt, consumers notice that over time prices have increased. Galloping inflation has a much larger impact of anywhere from 100% to 300% inflation. The most recent example of galloping inflation occurred in Latin American countries and former command economy Communist nations. Hyperinflation is when the percentage exceeds 500% interest per year, however, if this should actually occur then the next step would be a total collapse of the economy.
To read more about hyperinflation, read the following article: How 9 Countries Saw Inflation Evolve into Hyperinflation.
Tracking Inflation
Dinner table conversations where you might have heard about inflation usually entail reminiscing about when “everything seemed to cost so much less. You used to be able to buy three gallons of gasoline for a dollar and then go see an afternoon movie for another dollar.” Table 1 compares some prices of common goods in 1970 and 2012. Of course, the average prices shown in this table may not reflect the prices where you live. The cost of living in New York City is much higher than in Houston, Texas, for example. In addition, certain products have evolved over recent decades. A new car in 2012, loaded with antipollution equipment, safety gear, computerized engine controls, and many other technological advances, is a more advanced machine (and more fuel efficient) than your typical 1970s car. However, put details like these to one side for the moment and look at the overall pattern. The primary reason behind the price rises in Table 1—and all the price increases for the other products in the economy—is not specific to the market for housing or cars or gasoline or movie tickets. Instead, it is part of a general rise in the level of all prices. In 2012, $1 had about the same purchasing power in overall terms of goods and services as 18 cents did in 1970, because of the amount of inflation that has occurred over that time period.
| Items | 1970 | 2012 |
| Pound of ground beef | $0.66 | $3.24 |
| Pound of butter | $0.87 | $2.80 |
| Movie ticket | $1.55 | $7.96 |
| Sales price of existing home | $23,000 | $185,283 |
| New car | $3,000 | $30,303 |
| Gallon of gasoline | $0.36 | $3.48 |
| Average hourly wage for a manufacturing worker | $3.23 | $19.17 |
| Per capita GDP | $5,069 | $43,063 |
The power of inflation does not affect just goods and services, but it also affects wages and income levels, too. The second-to-last row of Table 1 shows that the average hourly wage for a manufacturing worker increased nearly six-fold from 1970 to 2012. Sure, the average worker in 2012 is better educated and more productive than the average worker in 1970—but not six times more productive. Sure, per capita GDP increased substantially from 1970 to 2012, but is the average person in the U.S. economy truly more than eight times better off in just 42 years? Not likely.
A modern economy has millions of goods and services whose prices are continually fluctuating due to supply and demand. How can all of these shifts in price be boiled down to a single inflation rate? As with many problems in economic measurement, the conceptual answer is reasonably straightforward: Prices of a variety of goods and services are combined into a single price level; the inflation rate is just the percentage change in the price level. Applying the concept, however, involves some practical difficulties.
The Price of a Basket of Goods
To calculate the price level, economists begin with the concept of a basket of goods and services, consisting of the different items individuals, businesses, or organizations typically buy. The next step is to look at how the prices of those items change over time. In thinking about how to combine individual prices into an overall price level, many people find that their first impulse is to calculate the average of the prices. Such a calculation, however, could easily be misleading because some products matter more than others.
Changes in the prices of goods for which people spend a larger share of their incomes will matter more than changes in the prices of goods for which people spend a smaller share of their incomes. For example, an increase of 10% in the rental rate on housing matters more to most people than whether the price of carrots rises by 10%. To construct an overall measure of the price level, economists compute a weighted average of the prices of the items in the basket, where the weights are based on the actual quantities of goods and services people buy.
Consider the simple basket of goods with only three items, represented in Table 2. Say that in any given month, a college student spends money on 20 hamburgers, one bottle of aspirin, and five movies. Prices for these items over four years are given in the table through each time period (Pd). Prices of some goods in the basket may rise while others fall. In this example, the price of aspirin does not change over the four years, while movies increase in price and hamburgers bounce up and down. Each year, the cost of buying the given basket of goods at the prices prevailing at that time is shown.
| Items | Hamburger | Aspirin | Movies | Total | Inflation Rate |
| Qty | 20 | 1 bottle | 5 | - | - |
| (Pd 1) Price | $3.00 | $10.00 | $6.00 | - | - |
| (Pd 1) Amount Spent | $60.00 | $10.00 | $30.00 | $100.00 | - |
| (Pd 2) Price | $3.20 | $10.00 | $6.50 | - | - |
| (Pd 2) Amount Spent | $64.00 | $10.00 | $32.50 | $106.50 | 6.5% |
| (Pd 3) Price | $3.10 | $10.00 | $7.00 | - | - |
| (Pd 3) Amount Spent | $62.00 | $10.00 | $35.00 | $107.00 | 0.5% |
| (Pd 4) Price | $3.50 | $10.00 | $7.50 | - | - |
| (Pd 4) Amount Spent | $70.00 | $10.00 | $37.50 | $117.50 | 9.8% |
To calculate the annual rate of inflation in this example:
Step 1. Find the percentage change in the cost of purchasing the overall basket of goods between the time periods.
Step 2. From period 1 to period 2, the total cost of purchasing the basket of goods in Table 2 rises from $100 to $106.50.
Therefore, the percentage change over this time—the inflation rate—is:
(106.50 – 100)
100.0 = 0.065 = 6.5%
Step 3. From period 2 to period 3, the overall change in the cost of purchasing the basket rises from $106.50 to $107. Thus, the inflation rate over this time, again calculated by the percentage change, is approximately:
(107 – 106.50)
106.50 = 0.0047 = 0.47%
Step 4. From period 3 to period 4, the overall cost rises from $107 to $117.50. The inflation rate is thus:
(117.50 – 107)
107 = 0.098 = 9.8%
This calculation of the change in the total cost of purchasing a basket of goods takes into account how much is spent on each good. Hamburgers are the lowest-priced good in this example, and aspirin is the highest-priced. If an individual buys a greater quantity of a low-price good, then it makes sense that changes in the price of that good should have a larger impact on the buying power of that person’s money. The larger impact of hamburgers shows up in the “amount spent” row, where, in all time periods, hamburgers are the largest item within the amount spent row.
What Happens During Episodes of Deflation?
Deflation occurs when the rate of inflation is negative; that is, instead of money having less purchasing power over time, as occurs with inflation, money is worth more. Deflation can make it very difficult for monetary policy to address a recession.
Remember that the real interest rate is the nominal interest rate minus the rate of inflation. If the nominal interest rate is 7% and the rate of inflation is 3%, then the borrower is effectively paying a 4% real interest rate. If the nominal interest rate is 7% and there is deflation of 2%, then the real interest rate is actually 9%. In this way, an unexpected deflation raises the real interest payments for borrowers. It can lead to a situation where an unexpectedly high number of loans are not repaid, and banks find that their net worth is decreasing or negative. When banks are suffering losses, they become less able and eager to make new loans. Aggregate demand declines, which can lead to recession.
Then the double-whammy: After causing a recession, deflation can make it difficult for monetary policy to work. Say that the central bank uses expansionary monetary policy to reduce the nominal interest rate all the way to zero—but the economy has 5% deflation. As a result, the real interest rate is 5%, and because a central bank cannot make the nominal interest rate negative, expansionary policy cannot reduce the real interest rate further.
In the U.S. economy during the early 1930s, deflation was 6.7% per year from 1930–1933, which caused many borrowers to default on their loans and many banks to end up bankrupt, which in turn contributed substantially to the Great Depression. Not all episodes of deflation, however, end in economic depression. Japan, for example, experienced deflation of slightly less than 1% per year from 1999–2002, which hurt the Japanese economy, but it still grew by about 0.9% per year over this period. Indeed, there is at least one historical example of deflation coexisting with rapid growth. The U.S. economy experienced deflation of about 1.1% per year over the quarter-century from 1876–1900, but real GDP also expanded at a rapid clip of 4% per year over this time, despite some occasional severe recessions.
The central bank should be on guard against deflation and, if necessary, use expansionary monetary policy to prevent any long-lasting or extreme deflation from occurring. Except in severe cases like the Great Depression, deflation does not guarantee economic disaster.
Index Numbers
The numerical results of a calculation based on a basket of goods can get a little messy. The simplified example in Table 2 has only three goods and the prices are in even dollars, not numbers like 79 cents or $124.99. If the list of products was much longer, and more realistic prices were used, the total quantity spent over a year might be some messy-looking number like $17,147.51 or $27,654.92.
To simplify the task of interpreting the price levels for more realistic and complex baskets of goods, the price level in each period is typically reported as an index number, rather than as the dollar amount for buying the basket of goods. Price indices are created to calculate an overall average change in relative prices over time. To convert the money spent on the basket to an index number, economists arbitrarily choose one year to be the base year, or starting point from which we measure changes in prices. The base year, by definition, has an index number equal to 100. This sounds complicated, but it is really a simple math trick. In the example above, say that time period 3 is chosen as the base year. Since the total amount of spending in that year is $107, we divide that amount by itself ($107) and multiply by 100. Mathematically, that is equivalent to dividing $107 by 100, or $1.07. Doing either will give us an index in the base year of 100. Again, this is because the index number in the base year always has to have a value of 100. Then, to figure out the values of the index number for the other years, we divide the dollar amounts for the other years by 1.07 as well. Note also that the dollar signs cancel out so that index numbers have no units.
Calculations for the other values of the index number, based on the example presented in Table 2 are shown in Table 3. Because the index numbers are calculated so that they are in exactly the same proportion as the total dollar cost of purchasing the basket of goods, the inflation rate can be calculated based on the index numbers, using the percentage change formula. So, the inflation rate from period 1 to period 2 would be
(99.5 – 93.4) 93.4 = 0.065 = 6.5%
This is the same answer that was derived when measuring inflation based on the dollar cost of the basket of goods for the same time period.
| Total Spending | Index Number | Inflation Rate Since Previous Period | |
| Period 1 | $100 | 100/ 1.07 = 93.4 | |
| Period 2 | $106.50 | 106.50/ 1.07 = 99.5 | (99.5 – 93.4)93.4 = 0.065 = 6.5% |
| Period 3 | $107 | 107/ 1.07 = 100.0 | 100 – 99.599.5 = 0.005 = 0.5% |
| Period 4 | $117.50 | 117.50/ 1.07 = 109.8 | 109.8 – 100100 = 0.098 = 9.8% |
If the inflation rate is the same whether it is based on dollar values or index numbers, then why bother with the index numbers? The advantage is that indexing allows easier eyeballing of the inflation numbers. If you glance at two index numbers like 107 and 110, you know automatically that the rate of inflation between the two years is about, but not quite exactly equal to, 3%. By contrast, imagine that the price levels were expressed in absolute dollars of a large basket of goods, so that when you looked at the data, the numbers were $19,493.62 and $20,009.32. Most people find it difficult to eyeball those kinds of numbers and say that it is a change of about 3%. However, the two numbers expressed in absolute dollars are exactly in the same proportion of 107 to 110 as the previous example.
Why Do You Not Just Subtract Index Numbers?
A word of warning: When a price index moves from, say, 107 to 110, the rate of inflation is not exactly 3%. Remember, the inflation rate is not derived by subtracting the index numbers, but rather through the percentage-change calculation. The precise inflation rate as the price index moves from 107 to 110 is calculated as (110 – 107) / 107 = 0.028 = 2.8%. When the base year is fairly close to 100, a quick subtraction is not a terrible shortcut to calculating the inflation rate—but when precision matters down to tenths of a percent, subtracting will not give the right answer.
Two final points about index numbers are worth remembering. First, index numbers have no dollar signs or other units attached to them. Although index numbers can be used to calculate a percentage inflation rate, the index numbers themselves do not have percentage signs. Index numbers just mirror the proportions found in other data. They transform the other data so that the data are easier to work with.
Second, the choice of a base year for the index number—that is, the year that is automatically set equal to 100—is arbitrary. It is chosen as a starting point from which changes in prices are tracked. In the official inflation statistics, it is common to use one base year for a few years, and then to update it, so that the base year of 100 is relatively close to the present. But any base year that is chosen for the index numbers will result in exactly the same inflation rate. To see this in the previous example, imagine that period 1, when total spending was $100, was also chosen as the base year, and given an index number of 100. At a glance, you can see that the index numbers would now exactly match the dollar figures, the inflation rate in the first period would be 6.5%, and so on.
The price level is measured by using a basket of goods and services and calculating how the total cost of buying that basket of goods will increase over time. The price level is often expressed in terms of index numbers, which transform the cost of buying the basket of goods and services into a series of numbers in the same proportion to each other but with an arbitrary base year of 100. The rate of inflation is measured as the percentage change between price levels or index numbers over time.
How Changes in the Cost of Living are Measured
The most commonly cited measure of inflation in the United States is the Consumer Price Index (CPI). The CPI is calculated by government statisticians at the U.S. Bureau of Labor Statistics based on the prices in a fixed basket of goods and services that represents the purchases of the average family of four. In recent years, the statisticians have paid considerable attention to a subtle problem: that the change in the total cost of buying a fixed basket of goods and services over time is conceptually not quite the same as the change in the cost of living, because the cost of living represents how much it costs for a person to feel that his or her consumption provides an equal level of satisfaction or utility.
To understand the distinction, imagine that over the past 10 years, the cost of purchasing a fixed basket of goods increased by 25% and your salary also increased by 25%. Has your personal standard of living held constant? If you do not necessarily purchase an identical fixed basket of goods every year, then an inflation calculation based on the cost of a fixed basket of goods may be a misleading measure of how your cost of living has changed. Two problems arise here: substitution bias and quality/new goods bias.
When the price of a good rises, consumers tend to purchase less of it and to seek out substitutes instead. Conversely, as the price of a good falls, people will tend to purchase more of it. This pattern implies that goods with generally rising prices should tend over time to become less important in the overall basket of goods used to calculate inflation, while goods with falling prices should tend to become more important. Consider, as an example, a rise in the price of peaches by $100 per pound. If consumers were utterly inflexible in their demand for peaches, this would lead to a big rise in the price of food for consumers. Alternatively, imagine that people are utterly indifferent to whether they have peaches or other types of fruit. Now, if peach prices rise, people completely switch to other fruit choices and the average price of food does not change at all. A fixed and unchanging basket of goods assumes that consumers are locked into buying exactly the same goods, regardless of price changes—not a very likely assumption. Thus, substitution bias—the rise in the price of a fixed basket of goods over time—tends to overstate the rise in a consumer’s true cost of living, because it does not take into account that the person can substitute away from goods whose relative prices have risen.
The other major problem in using a fixed basket of goods as the basis for calculating inflation is how to deal with the arrival of improved versions of older goods or altogether new goods. Consider the problem that arises if a cereal is improved by adding 12 essential vitamins and minerals—and also if a box of the cereal costs 5% more. It would clearly be misleading to count the entire resulting higher price as inflation because the new price is being charged for a product of higher (or at least different) quality. Ideally, one would like to know how much of the higher price is due to the quality change, and how much of it is just a higher price. The Bureau of Labor Statistics, which is responsible for the computation of the Consumer Price Index, must deal with these difficulties in adjusting for quality changes.
A new product can be thought of as an extreme improvement in quality—from something that did not exist to something that does. However, the basket of goods that was fixed in the past obviously does not include new goods created since then. The basket of goods and services used in the Consumer Price Index (CPI) is revised and updated over time, and so new products are gradually included. But the process takes some time. For example, room air conditioners were widely sold in the early 1950s, but were not introduced into the basket of goods behind the Consumer Price Index until 1964. The VCR and personal computer were available in the late 1970s and widely sold by the early 1980s, but did not enter the CPI basket of goods until 1987. By 1996, there were more than 40 million cellular phone subscribers in the United States—but cell phones were not yet part of the CPI basket of goods. The parade of inventions has continued, with the CPI inevitably lagging a few years behind.
The arrival of new goods creates problems with respect to the accuracy of measuring inflation. The reason people buy new goods, presumably, is that the new goods offer better value for money than existing goods. Thus, if the price index leaves out new goods, it overlooks one of the ways in which the cost of living is improving. In addition, the price of a new good is often higher when it is first introduced and then declines over time. If the new good is not included in the CPI for some years, until its price is already lower, the CPI may miss counting this price decline altogether. Taking these arguments together, the quality/new goods bias means that the rise in the price of a fixed basket of goods over time tends to overstate the rise in a consumer’s true cost of living, because it does not take into account how improvements in the quality of existing goods or the invention of new goods improves the standard of living. The following Clear It Up feature is a must-read on how the CPI is comprised and calculated.
Clear It Up: How do U.S. Government Statisticians Measure the Consumer Price Index?
When the U.S. Bureau of Labor Statistics (BLS) calculates the Consumer Price Index, the first task is to decide on a basket of goods that is representative of the purchases of the average household. This is done by using the Consumer Expenditure Survey, a national survey of about 7,000 households, which provides detailed information on spending habits. Consumer expenditures are broken up into eight major groups, shown below, which in turn are broken up into more than 200 individual item categories. The BLS currently uses 1982–1984 as the base period.
For each of the 200 individual expenditure items, the BLS chooses several hundred very specific examples of that item and looks at the prices of those examples. So, in figuring out the “breakfast cereal” item under the overall category of “foods and beverages,” the BLS picks several hundred examples of breakfast cereal. One example might be the price of a 24-oz. box of a particular brand of cereal sold at a particular store. The specific products and sizes and stores chosen are statistically selected to reflect what people buy and where they shop. The basket of goods in the Consumer Price Index thus consists of about 80,000 products; that is, several hundred specific products in over 200 broad-item categories. About one-quarter of these 80,000 specific products are rotated out of the sample each year, and replaced with a different set of products.
The next step is to collect data on prices. Data collectors visit or call about 23,000 stores in 87 urban areas all over the United States every month to collect prices on these 80,000 specific products. A survey of 50,000 landlords or tenants is also carried out to collect information about rents.
The Consumer Price Index is then calculated by taking the 80,000 prices of individual products and combining them, using weights (as shown in Figure 1) determined by the quantities of these products that people buy and allowing for factors like substitution between goods and quality improvements, into price indices for the 200 or so overall items. Then, the price indices for the 200 items are combined into an overall Consumer Price Index. According to the Consumer Price Index website, there are eight categories used by data collectors:
The Weighting of CPI Components

Of the eight categories used to generate the Consumer Price Index, housing is the highest at 41%. The next highest category, transportation at 16.8%, is less than half the size of housing. Other goods and services, and apparel are the lowest at 3.4% and 3.6%, respectively.
The CPI and Core Inflation Index
Imagine if you were driving a company truck across the country - you probably would care about things like the prices of available roadside food and motel rooms as well as the truck’s operating condition. However, the manager of the firm might have different priorities. He would care mostly about the truck’s on-time performance and much less so about the food you were eating and the places you were staying. In other words, the company manager would be paying attention to the production of the firm, while ignoring transitory elements that impacted you, but did not affect the company’s bottom line.
In a sense, a similar situation occurs with regard to measures of inflation. As we’ve learned, CPI measures prices as they affect everyday household spending. A core inflation index is typically calculated by taking the CPI and excluding volatile economic variables. In this way, economists have a better sense of the underlying trends in prices that affect the cost of living.
Examples of excluded variables include energy and food prices, which can jump around from month to month because of the weather. According to an article by Kent Bernhard, during Hurricane Katrina in 2005, a key supply point for the nation’s gasoline was nearly knocked out. Gas prices quickly shot up across the nation, in some places increasing by up to 40 cents a gallon in one day. This was not the cause of an economic policy but rather a short-lived event until the pumps were restored in the region. In this case, the CPI that month would register the change as a cost of living event to households, but the core inflation index would remain unchanged. As a result, the Federal Reserve’s decisions on interest rates would not be influenced. Similarly, droughts can cause world-wide spikes in food prices that, if temporary, do not affect the nation’s economic capability.
As former Chairman of the Federal Reserve Ben Bernanke noted in 1999 about the core inflation index, “It provide(s) a better guide to monetary policy than the other indices, since it measures the more persistent underlying inflation rather than transitory influences on the price level.” Bernanke also noted that it helps communicate that every inflationary shock need not be responded to by the Federal Reserve since some price changes are transitory and not part of a structural change in the economy.
In sum, both the CPI and the core inflation index are important but serve different audiences. The CPI helps households understand their overall cost of living from month to month, while the core inflation index is a preferred gauge from which to make important government policy changes.
Video: Measuring Inflation
Practical Solutions for the Substitution and the Quality/New Goods Biases
By the early 2000s, the Bureau of Labor Statistics was using alternative mathematical methods for calculating the Consumer Price Index, more complicated than just adding up the cost of a fixed basket of goods, to allow for some substitution between goods. It was also updating the basket of goods behind the CPI more frequently so that new and improved goods could be included more rapidly. For certain products, the BLS was carrying out studies to try to measure the quality improvement. For example, with computers, an economic study can try to adjust for changes in speed, memory, screen size, and other characteristics of the product, and then calculate the change in price after these product changes are taken into account. But these adjustments are inevitably imperfect, and exactly how to make these adjustments is often a source of controversy among professional economists.
By the early 2000s, the substitution bias and quality/new goods bias had been somewhat reduced, so that since then the rise in the CPI probably overstates the true rise in inflation by only about 0.5% per year. Over one or a few years, this is not much; over a period of a decade or two, even half of a percent per year compounds to a more significant amount. In addition, the CPI tracks prices from physical locations, and not at online sites like Amazon, where prices can be lower.
When measuring inflation (and other economic statistics, too), a trade-off arises between simplicity and interpretation. If the inflation rate is calculated with a basket of goods that is fixed and unchanging, then the calculation of an inflation rate is straightforward, but the problems of substitution bias and quality/new goods bias will arise. However, when the basket of goods is allowed to shift and evolve to reflect substitution toward lower relative prices, quality improvements, and new goods, the technical details of calculating the inflation rate grow more complex.
Additional Price Indices: PPI, GDP Deflator, and More
The basket of goods behind the Consumer Price Index represents an average hypothetical U.S. household, which is to say that it does not exactly capture anyone’s personal experience. When the task is to calculate an average level of inflation, this approach works fine. What if, however, you are concerned about inflation experienced by a certain group, like the elderly, or the poor, or single-parent families with children, or Hispanic-Americans? In specific situations, a price index based on the buying power of the average consumer may not feel quite right.
This problem has a straightforward solution. If the Consumer Price Index does not serve the desired purpose, then invent another index, based on a basket of goods appropriate for the group of interest. Indeed, the Bureau of Labor Statistics publishes a number of experimental price indices: some for particular groups like the elderly or the poor, some for different geographic areas, and some for certain broad categories of goods like food or housing.
The BLS also calculates several price indices that are not based on baskets of consumer goods. For example, the Producer Price Index (PPI) is based on prices paid for supplies and inputs by producers of goods and services. It can be broken down into price indices for different industries, commodities, and stages of processing (like finished goods, intermediate goods, crude materials for further processing, and so on). There is an International Price Index based on the prices of merchandise that is exported or imported. An Employment Cost Index measures wage inflation in the labor market. The GDP deflator, measured by the Bureau of Economic Analysis, is a price index that includes all the components of GDP (that is, consumption plus investment plus government plus exports minus imports). Unlike the CPI, its baskets are not fixed but re-calculate what that year’s GDP would have been worth using the base-year’s prices.
What’s the best measure of inflation? If concerned with the most accurate measure of inflation, use the GDP deflator as it picks up the prices of goods and services produced. However, it is not a good measure of cost of living as it includes prices of many products not purchased by households (for example, aircraft, fire engines, factory buildings, office complexes, and bulldozers). If one wants the most accurate measure of inflation as it impacts households, use the CPI, as it only picks up prices of products purchased by households. That is why the CPI is sometimes referred to as the cost-of-living index. As the Bureau of Labor Statistics states on its website: “The ‘best’ measure of inflation for a given application depends on the intended use of the data.”
Measuring price levels with a fixed basket of goods will always have two problems: the substitution bias, by which a fixed basket of goods does not allow for buying more of what is relatively less expensive and less of what is relatively more expensive; and the quality/new goods bias, by which a fixed basket cannot take into account improvements in quality and the advent of new goods. These problems can be reduced in degree—for example, by allowing the basket of goods to evolve over time—but they cannot be totally eliminated. The most commonly cited measure of inflation is the Consumer Price Index (CPI), which is based on a basket of goods representing what the typical consumer buys. The Core Inflation Index further breaks down the CPI by excluding volatile economic variables. Several price indices are not based on baskets of consumer goods. The GDP deflator is based on all the components of GDP. The Producer Price Index is based on prices of supplies and inputs bought by producers of goods and services. An Employment Cost Index measures wage inflation in the labor market. An International Price Index is based on the prices of merchandise that is exported or imported.
How the U.S. and Other Countries Experience Inflation
In the last three decades, inflation has been relatively low in the U.S. economy, with the Consumer Price Index typically rising 2% to 4% per year. Looking back over the twentieth century, there have been several periods where inflation caused the price level to rise at double-digit rates, but nothing has come close to hyperinflation.
Historical Inflation in the U.S. Economy
Figure 2 (a) shows the level of prices in the Consumer Price Index stretching back to 1916. In this case, the base years (when the CPI is defined as 100) are set for the average level of prices that existed from 1982 to 1984. Figure 2 (b) shows the annual percentage changes in the CPI over time, which is the inflation rate.
U.S. Price Level and Inflation Rates since 1913
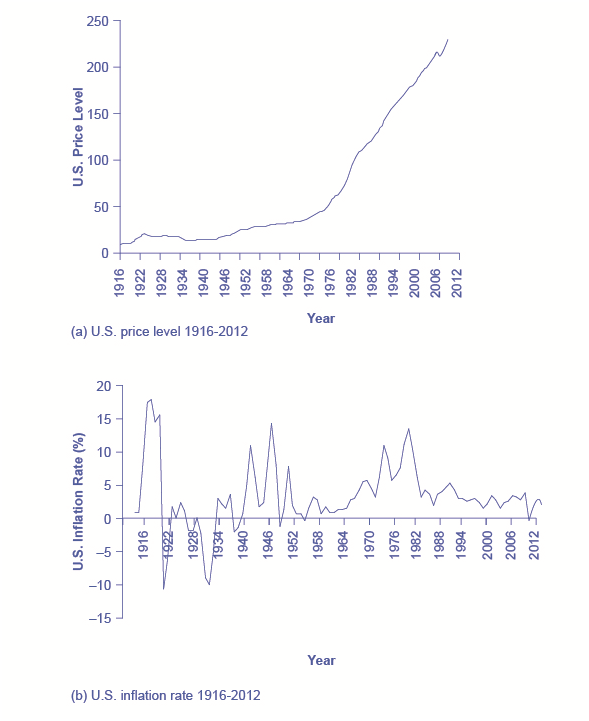
(a) The U.S. price level rose relatively little over the first half of the twentieth century but has increased more substantially in recent decades. The upward slope of the price level was especially steep in the 1970s, which reflects the high rate of inflation in that decade. (b) Inflation during the twentieth century was highest just after World Wars I and II, and during the 1970s. Deflation—that is, negative inflation, when most prices are falling—occurred several times in the first half of the century and in 2009 as well. Inflation rates since the 1990s have been in the low single digits. (Source: http://data.bls.gov/cgi-bin/surveymost)
The first two waves of inflation are easy to characterize in historical terms: they are right after World War I and World War II. However, there are also two periods of severe negative inflation—called deflation—in the early decades of the twentieth century: one following the deep recession of 1920–21 and the other during the Great Depression of the 1930s. (Since inflation is a time when the buying power of money in terms of goods and services is reduced, deflation will be a time when the buying power of money in terms of goods and services increases.) For the period from 1900 to about 1960, the major inflations and deflations nearly balanced each other out, so the average annual rate of inflation over these years was only about 1% per year. The third wave of more severe inflation arrived in the 1970s and departed in the early 1980s.
Times of recession or depression often seem to be times when the inflation rate is lower, as in the recession of 1920–1921, the Great Depression, the recession of 1980–1982, and the Great Recession in 2008–2009. There were a few months in 2009 that were deflationary, but not at an annual rate. Recessions are typically accompanied by higher levels of unemployment, and the total demand for goods falls, pulling the price level down. Conversely, the rate of inflation often, but not always, seems to start moving up when the economy is growing very strongly, like right after wartime or during the 1960s. The frameworks for macroeconomic analysis, developed in other chapters, will explain why recession often accompanies higher unemployment and lower inflation, while rapid economic growth often brings lower unemployment but higher inflation.
Inflation around the World
Around the rest of the world, the pattern of inflation has been very mixed, as can be seen in Figure 3 which shows inflation rates over the last several decades. Many industrialized countries, not just the United States, had relatively high inflation rates in the 1970s. For example, in 1975, Japan’s inflation rate was over 8% and the inflation rate for the United Kingdom was almost 25%. In the 1980s, inflation rates came down in the United States and in Europe and have largely stayed down.
Countries with Relatively Low Inflation Rates, 1960–2012
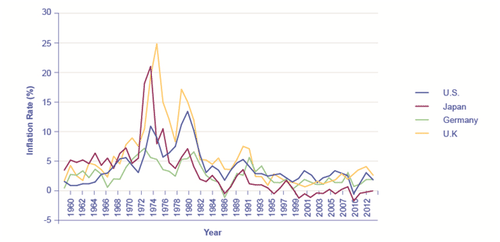
This chart shows the annual percentage change in consumer prices compared with the previous year’s consumer prices in the United States, the United Kingdom, Japan, and Germany.
Countries with controlled economies in the 1970s, like the Soviet Union and China, historically had very low rates of measured inflation—because prices were forbidden to rise by law, except for the cases where the government deemed a price increase to be due to quality improvements. However, these countries also had perpetual shortages of goods, since forbidding prices to rise acts like a price ceiling and creates a situation where quantity demanded often exceeds quantity supplied. As Russia and China made a transition toward more market-oriented economies, they also experienced outbursts of inflation, although the statistics for these economies should be regarded as somewhat shakier. Inflation in China averaged about 10% per year for much of the 1980s and early 1990s, although it has dropped off since then. Russia experienced hyperinflation—an outburst of high inflation—of 2,500% per year in the early 1990s, although by 2006 Russia’s consumer price inflation had dipped below 10% per year, as shown in Figure 4. The closest the United States has ever gotten to hyperinflation was during the Civil War, 1860–1865, in the Confederate states.
Countries with Relatively High Inflation Rates, 1980–2012
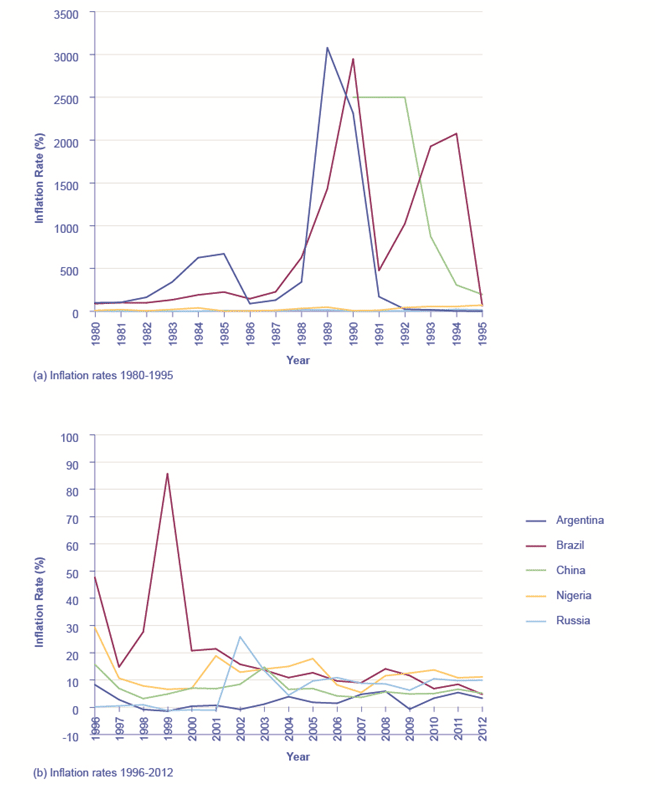
These charts show the percentage change in consumer prices compared with the previous year’s consumer prices in Argentina, Brazil, China, Nigeria, and Russia. (a) Of these, Argentina, Brazil, and Russia all experienced hyperinflation at some point between the mid-1980s and mid-1990s. (b) Though not as high, China and Nigeria also had high inflation rates in the mid-1990s. Even though their inflation rates have come down over the last two decades, several of these countries continue to see significant inflation rates. (Source: http://www.tradingeconomics.com/)
Many countries in Latin America experienced raging hyperinflation during the 1980s and early 1990s, with inflation rates often well above 100% per year. In 1990, for example, both Brazil and Argentina saw inflation climb above 2000%. Certain countries in Africa experienced extremely high rates of inflation, sometimes bordering on hyperinflation, in the 1990s. Nigeria, the most populous country in Africa, had an inflation rate of 75% in 1995.
In the early 2000s, the problem of inflation appears to have diminished for most countries, at least in comparison to the worst times of recent decades. As we noted earlier, in recent years, the world’s worst example of hyperinflation was in Zimbabwe, where at one point the government was issuing bills with a face value of $100 trillion (in Zimbabwean dollars)—that is, the bills had $100,000,000,000,000 written on the front, but were almost worthless. In many countries, the memory of double-digit, triple-digit, and even quadruple-digit inflation is not very far in the past.
In the U.S. economy, the annual inflation rate in the last two decades has typically been around 2% to 4%. The periods of highest inflation in the United States in the twentieth century occurred during the years after World Wars I and II, and in the 1970s. The period of lowest inflation—actually, with deflation—was the Great Depression of the 1930s.
The Confusion Over Inflation
Economists usually oppose high inflation, but they oppose it in a milder way than many non-economists. Robert Shiller, one of 2013’s Nobel Prize winners in economics, carried out several surveys during the 1990s about attitudes toward inflation. One of his questions asked, “Do you agree that preventing high inflation is an important national priority, as important as preventing drug abuse or preventing deterioration in the quality of our schools?” Answers were on a scale of 1–5, where 1 meant “Fully agree” and 5 meant “Completely disagree.” For the U.S. population as a whole, 52% answered “Fully agree” that preventing high inflation was a highly important national priority and just 4% said “Completely disagree.” However, among professional economists, only 18% answered “Fully agree,” while the same percentage of 18% answered “Completely disagree.”
The Land of Funny Money
What are the economic problems caused by inflation, and why do economists often regard them with less concern than the general public? Consider a very short story: “The Land of Funny Money.”
One morning, everyone in the Land of Funny Money awakened to find that everything denominated in money had increased by 20%. The change was completely unexpected. Every price in every store was 20% higher. Paychecks were 20% higher. Interest rates were 20% higher. The amount of money, everywhere from wallets to savings accounts, was 20% larger. This overnight inflation of prices made newspaper headlines everywhere in the Land of Funny Money. But the headlines quickly disappeared, as people realized that in terms of what they could actually buy with their incomes, this inflation had no economic impact. Everyone’s pay could still buy exactly the same set of goods as it did before. Everyone’s savings were still sufficient to buy exactly the same car, vacation, or retirement that they could have bought before. Equal levels of inflation in all wages and prices ended up not mattering much at all.
When the people in Robert Shiller’s surveys explained their concern about inflation, one typical reason was that they feared that as prices rose, they would not be able to afford to buy as much. In other words, people were worried because they did not live in a place like the Land of Funny Money, where all prices and wages rose simultaneously. Instead, people live here on Planet Earth, where prices might rise while wages do not rise at all, or where wages rise more slowly than prices.
Economists note that over most periods, the inflation level in prices is roughly similar to the inflation level in wages, and so they reason that, on average, over time, people’s economic status is not greatly changed by inflation. If all prices, wages, and interest rates adjusted automatically and immediately with inflation, as in the Land of Funny Money, then no one’s purchasing power, profits, or real loan payments would change. However, if other economic variables do not move exactly in sync with inflation, or if they adjust for inflation only after a time lag, then inflation can cause three types of problems: unintended redistributions of purchasing power, blurred price signals, and difficulties in long-term planning.
Unintended Redistributions of Purchasing Power
Inflation can cause redistributions of purchasing power that hurt some and help others. People who are hurt by inflation include those who are holding a lot of cash, whether it is in a safe deposit box or in a cardboard box under the bed. When inflation happens, the buying power of cash is diminished. But cash is only an example of a more general problem: anyone who has financial assets invested in a way that the nominal return does not keep up with inflation will tend to suffer from inflation. For example, if a person has money in a bank account that pays 4% interest, but inflation rises to 5%, then the real rate of return for the money invested in that bank account is negative 1%.
The problem of a good-looking nominal interest rate being transformed into an ugly-looking real interest rate can be worsened by taxes. The U.S. income tax is charged on the nominal interest received in dollar terms, without an adjustment for inflation. So, a person who invests $10,000 and receives a 5% nominal rate of interest is taxed on the $500 received—no matter whether the inflation rate is 0%, 5%, or 10%. If inflation is 0%, then the real interest rate is 5% and all $500 is a gain in buying power. But if inflation is 5%, then the real interest rate is zero and the person had no real gain—but owes income tax on the nominal gain anyway. If inflation is 10%, then the real interest rate is negative 5% and the person is actually falling behind in buying power, but would still owe taxes on the $500 in nominal gains.
Inflation can cause unintended redistributions for wage earners, too. Wages do typically creep up with inflation over time eventually. The start of this chapter showed that average hourly wage in the U.S. economy increased from $3.23 in 1970 to $19.20 in 2012, which is an increase by a factor of almost six. Over that time period, the Consumer Price Index increased by an almost identical amount. However, increases in wages may lag behind inflation for a year or two, since wage adjustments are often somewhat sticky and occur only once or twice a year. Moreover, the extent to which wages keep up with inflation creates insecurity for workers and may involve painful, prolonged conflicts between employers and employees. If the minimum wage is adjusted for inflation only infrequently, minimum wage workers are losing purchasing power from their nominal wages, as shown in Figure 5.
U.S. Minimum Wage and Inflation
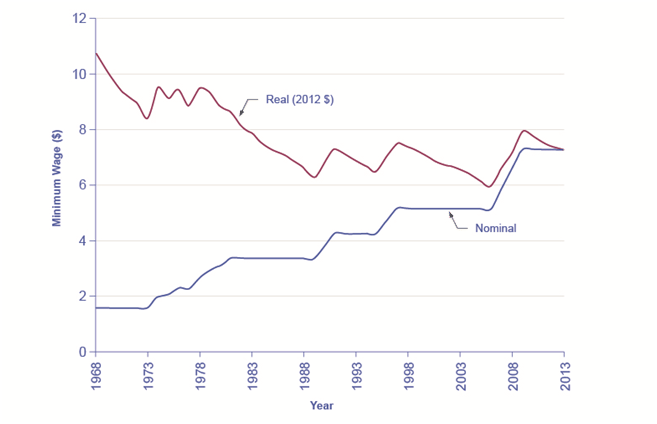
After adjusting for inflation, the federal minimum wage dropped more than 30 percent from 1967 to 2010, even though the nominal figure climbed from $1.40 to $7.25 per hour. Increases in the minimum wage in between 2008 and 2010 kept the decline from being worse—as it would have been if the wage had remained the same as it did from 1997 through 2007. (Sources: http://www.dol.gov/whd/minwage/chart.htm; http://data.bls.gov/cgi-bin/surveymost?cu)
One sizable group of people has often received a large share of their income in a form that does not increase over time: retirees who receive a private company pension. Most pensions have traditionally been set as a fixed nominal dollar amount per year at retirement. For this reason, pensions are called “defined benefits” plans. Even if inflation is low, the combination of inflation and a fixed income can create a substantial problem over time. A person who retires on a fixed income at age 65 will find that losing just 1% to 2% of buying power per year to inflation compounds to a considerable loss of buying power after a decade or two.
Fortunately, pensions and other defined benefits retirement plans are increasingly rare, replaced instead by “defined contribution” plans, such as 401(k)s and 403(b)s. In these plans, the employer contributes a fixed amount to the worker’s retirement account on a regular basis (usually every pay check). The employee often contributes as well. The worker invests these funds in a wide range of investment vehicles. These plans are tax deferred, and they are portable so that if the individual takes a job with a different employer, their 401(k) comes with them. To the extent that the investments made generate real rates of return, retirees do not suffer from the inflation costs of traditional pensioners.
However, ordinary people can sometimes benefit from the unintended redistributions of inflation. Consider someone who borrows $10,000 to buy a car at a fixed interest rate of 9%. If inflation is 3% at the time the loan is made, then the loan must be repaid at a real interest rate of 6%. But if inflation rises to 9%, then the real interest rate on the loan is zero. In this case, the borrower’s benefit from inflation is the lender’s loss. A borrower paying a fixed interest rate, who benefits from inflation, is just the flip side of an investor receiving a fixed interest rate, who suffers from inflation. The lesson is that when interest rates are fixed, rises in the rate of inflation tend to penalize suppliers of financial capital, who end up being repaid in dollars that are worth less because of inflation, while demanders of financial capital end up better off, because they can repay their loans in dollars that are worth less than originally expected.
The unintended redistributions of buying power caused by inflation may have a broader effect on society. America’s widespread acceptance of market forces rests on a perception that people’s actions have a reasonable connection to market outcomes. When inflation causes a retiree who built up a pension or invested at a fixed interest rate to suffer, however, while someone who borrowed at a fixed interest rate benefits from inflation, it is hard to believe that this outcome was deserved in any way. Similarly, when homeowners benefit from inflation because the price of their homes rises, while renters suffer because they are paying higher rent, it is hard to see any useful incentive effects. One of the reasons that inflation is so disliked by the general public is a sense that it makes economic rewards and penalties more arbitrary—and therefore likely to be perceived as unfair – even dangerous.
Video: Horror Stories of Hyperinflation
Is There a Connection between German Hyperinflation and Hitler's Rise to Power?
Germany suffered an intense hyperinflation of its currency, the Mark, in the years after World War I, when the Weimar Republic in Germany resorted to printing money to pay its bills and the onset of the Great Depression created the social turmoil that Adolf Hitler could take advantage of in his rise to power. Shiller described the connection this way in a National Bureau of Economic Research 1996 Working Paper:
A fact that is probably little known to young people today, even in Germany, is that the final collapse of the Mark in 1923, the time when the Mark’s inflation reached astronomical levels (inflation of 35,974.9% in November 1923 alone, for an annual rate that month of 4.69 × 1028%), came in the same month as did Hitler’s Beer Hall Putsch, his Nazi Party’s armed attempt to overthrow the German government. This failed putsch resulted in Hitler’s imprisonment, at which time he wrote his book Mein Kampf, setting forth an inspirational plan for Germany’s future, suggesting plans for world domination. . .
". . . Most people in Germany today probably do not clearly remember these events; this lack of attention to it may be because its memory is blurred by the more dramatic events that succeeded it (the Nazi seizure of power and World War II). However, to someone living through these historical events in sequence . . . [the putsch] may have been remembered as vivid evidence of the potential effects of inflation."
Blurred Price Signals
Prices are the messengers in a market economy, conveying information about conditions of demand and supply. Inflation blurs those price messages. Inflation means that price signals are perceived more vaguely, like a radio program received with a lot of static. If the static becomes severe, it is hard to tell what is happening.
In Israel, when inflation accelerated to an annual rate of 500% in 1985, some stores stopped posting prices directly on items, since they would have had to put new labels on the items or shelves every few days to reflect inflation. Instead, a shopper just took items from a shelf and went up to the checkout register to find out the price for that day. Obviously, this situation makes comparing prices and shopping for the best deal rather difficult. When the levels and changes of prices become uncertain, businesses and individuals find it harder to react to economic signals. In a world where inflation is at a high rate, but bouncing up and down to some extent, does a higher price of a good mean that inflation has risen, or that supply of that good has decreased, or that demand for that good has increased? Should a buyer of the good take the higher prices as an economic hint to start substituting other products—or have the prices of the substitutes risen by an equal amount? Should a seller of the good take a higher price as a reason to increase production—or is the higher price only a sign of a general inflation in which the prices of all inputs to production are rising as well? The true story will presumably become clear over time, but at a given moment, who can say?
High and variable inflation means that the incentives in the economy to adjust in response to changes in prices are weaker. Markets will adjust toward their equilibrium prices and quantities more erratically and slowly, and many individual markets will experience a greater chance of surpluses and shortages.
Problems of Long-Term Planning
Inflation can make long-term planning difficult. In discussing unintended redistributions, we considered the case of someone trying to plan for retirement with a pension that is fixed in nominal terms and a high rate of inflation. Similar problems arise for all people trying to save for retirement, because they must consider what their money will really buy several decades in the future when the rate of future inflation cannot be known with certainty.
Inflation, especially at moderate or high levels, will pose substantial planning problems for businesses, too. A firm can make money from inflation—for example, by paying bills and wages as late as possible so that it can pay in inflated dollars, while collecting revenues as soon as possible. A firm can also suffer losses from inflation, as in the case of a retail business that gets stuck holding too much cash, only to see the value of that cash eroded by inflation. But when a business spends its time focusing on how to profit by inflation, or at least how to avoid suffering from it, an inevitable tradeoff strikes: less time is spent on improving products and services or on figuring out how to make existing products and services more cheaply. An economy with high inflation rewards businesses that have found clever ways of profiting from inflation, which are not necessarily the businesses that excel at productivity, innovation, or quality of service.
In the short term, low or moderate levels of inflation may not pose an overwhelming difficulty for business planning, because costs of doing business and sales revenues may rise at similar rates. If, however, inflation varies substantially over the short or medium term, then it may make sense for businesses to stick to shorter-term strategies. The evidence as to whether relatively low rates of inflation reduce productivity is controversial among economists. There is some evidence that if inflation can be held to moderate levels of less than 3% per year, it need not prevent a nation’s real economy from growing at a healthy pace. For some countries that have experienced hyperinflation of several thousand percent per year, an annual inflation rate of 20–30% may feel basically the same as zero. However, several economists have pointed to the suggestive fact that when U.S. inflation heated up in the early 1970s—to 10%—U.S. growth in productivity slowed down, and when inflation slowed down in the 1980s, productivity edged up again not long thereafter, as shown in Figure 6.
U.S. Inflation Rate and U.S. Labor Productivity, 1961-2012
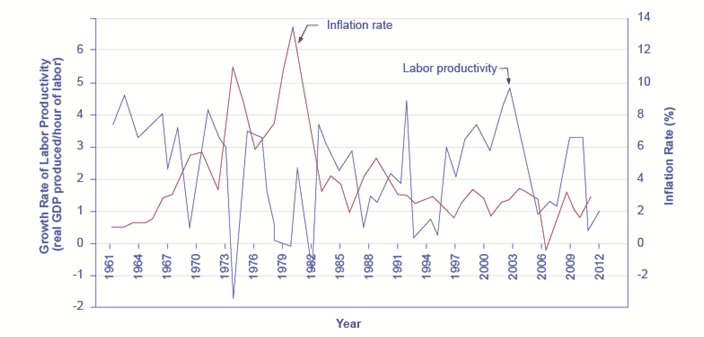
Over the last several decades in the United States, there have been times when rising inflation rates have been closely followed by lower productivity rates and lower inflation rates have corresponded to increasing productivity rates. As the graph shows, however, this correlation does not always exist.
Any Benefits of Inflation?
Although the economic effects of inflation are primarily negative, two countervailing points are worth noting. First, the impact of inflation will differ considerably according to whether it is creeping up slowly at 0% to 2% per year, galloping along at 10% to 20% per year, or racing to the point of hyperinflation at, say, 40% per month. Hyperinflation can rip an economy and a society apart. An annual inflation rate of 2%, 3%, or 4%, however, is a long way from a national crisis. Low inflation is also better than deflation which occurs with severe recessions.
Second, an argument is sometimes made that moderate inflation may help the economy by making wages in labor markets more flexible. The discussion in Unemployment pointed out that wages tend to be sticky in their downward movements and that unemployment can result. A little inflation could nibble away at real wages, and thus help real wages to decline if necessary. In this way, even if a moderate or high rate of inflation may act as sand in the gears of the economy, perhaps a low rate of inflation serves as oil for the gears of the labor market. This argument is controversial. A full analysis would have to take all the effects of inflation into account. It does, however, offer another reason to believe that, all things considered, very low rates of inflation may not be especially harmful.
Unexpected inflation will tend to hurt those whose money received, in terms of wages and interest payments, does not rise with inflation. In contrast, inflation can help those who owe money that can be paid in less valuable, inflated dollars. Low rates of inflation have relatively little economic impact over the short term. Over the medium and the long term, even low rates of inflation can complicate future planning. High rates of inflation can muddle price signals in the short term and prevent market forces from operating efficiently, and can vastly complicate long-term savings and investment decisions.
Indexing and Its Limitations
When a price, wage, or interest rate is adjusted automatically with inflation, it is said to be indexed. An indexed payment increases according to the index number that measures inflation. A wide array of indexing arrangements is observed in private markets and government programs. Since the negative effects of inflation depend in large part on having inflation unexpectedly affect one part of the economy but not another—say, increasing the prices that people pay but not the wages that workers receive—indexing will take some of the sting out of inflation.
Indexing in Private Markets
In the 1970s and 1980s, labor unions commonly negotiated wage contracts that had cost-of-living adjustments (COLAs) which guaranteed that their wages would keep up with inflation. These contracts were sometimes written as, for example, COLA plus 3%. Thus, if inflation was 5%, the wage increase would automatically be 8%, but if inflation rose to 9%, the wage increase would automatically be 12%. COLAs are a form of indexing applied to wages.
Loans often have built-in inflation adjustments, too, so that if the inflation rate rises by two percentage points, then the interest rate charged on the loan rises by two percentage points as well. An adjustable-rate mortgage (ARM) is a kind of loan used to purchase a home in which the interest rate varies with the rate of inflation. Often, a borrower will be able receive a lower interest rate if borrowing with an ARM, compared to a fixed-rate loan. The reason is that with an ARM, the lender is protected against the risk that higher inflation will reduce the real loan payments, and so the risk premium part of the interest rate can be correspondingly lower.
A number of ongoing or long-term business contracts also have provisions that prices will be adjusted automatically according to inflation. Sellers like such contracts because they are not locked into a low nominal selling price if inflation turns out higher than expected; buyers like such contracts because they are not locked into a high buying price if inflation turns out to be lower than expected. A contract with automatic adjustments for inflation in effect agrees on a real price to be paid, rather than a nominal price.
Indexing in Government Programs
Many government programs are indexed to inflation. The U.S. income tax code is designed so that as a person’s income rises above certain levels, the tax rate on the marginal income earned rises as well; this is what is meant by the expression “move into a higher tax bracket.” For example, according to the basic tax tables from the Internal Revenue Service, in 2013 a single person owed 10% of all taxable income from $0 to $8,925; 15% of all income from $8,926 to $36,250; 25% of all income from $36,251 to $87,850; 28% of all income from $87,851 to $183,250; 33% of all income from $183,251 to $398,350; 35% of all income from $398,351 to $400,000; and 39.6% on all income from $400,001 and above.
Because of the many complex provisions in the rest of the tax code, the taxes owed by any individual cannot be exactly determined based on these numbers, but the numbers illustrate the basic theme that tax rates rise as the marginal dollar of income rises. Until the late 1970s, if nominal wages increased along with inflation, people were moved into higher tax brackets and owed a higher proportion of their income in taxes, even though their real income had not risen. This “bracket creep,” as it was called, was eliminated by law in 1981. Now, the income levels where higher tax rates kick in are indexed to rise automatically with inflation.
The Social Security program offers two examples of indexing. Since the passage of the Social Security Indexing Act of 1972, the level of Social Security benefits increases each year along with the Consumer Price Index. Also, Social Security is funded by payroll taxes, which are imposed on the income earned up to a certain amount—$113,700 in 2013. This level of income is adjusted upward each year according to the rate of inflation, so that the indexed rise in the benefit level is accompanied by an indexed increase in the Social Security tax base.
As yet another example of a government program affected by indexing, in 1996 the U.S., government began offering indexed bonds. Bonds are means by which the U.S. government (and many private-sector companies as well) borrows money; that is, investors buy the bonds, and then the government repays the money with interest. Traditionally, government bonds have paid a fixed rate of interest. This policy gave a government that had borrowed an incentive to encourage inflation, because it could then repay its past borrowing in inflated dollars at a lower real interest rate. But indexed bonds promise to pay a certain real rate of interest above whatever inflation rate occurs. In the case of a retiree trying to plan for the long term and worried about the risk of inflation, for example, indexed bonds that guarantee a rate of return higher than inflation—no matter the level of inflation—can be a very comforting investment.
Might Indexing Reduce Concern over Inflation?
Indexing may seem like an obviously useful step. After all, when individuals, firms, and government programs are indexed against inflation, then people can worry less about arbitrary redistributions and other effects of inflation.
However, some of the fiercest opponents of inflation express grave concern about indexing. They point out that indexing is always partial. Not every employer will provide COLAs for workers. Not all companies can assume that costs and revenues will rise in lockstep with the general rates of inflation. Not all interest rates for borrowers and savers will change to match inflation exactly. But as partial inflation indexing spreads, the political opposition to inflation may diminish. After all, older people whose Social Security benefits are protected against inflation, or banks that have loaned their money with adjustable-rate loans, no longer have as much reason to care whether inflation heats up. In a world where some people are indexed against inflation and some are not, financially savvy businesses and investors may seek out ways to be protected against inflation, while the financially unsophisticated and small businesses may suffer from it most.
A Preview of Policy Discussions of Inflation
This chapter has focused on how inflation is measured, historical experience with inflation, how to adjust nominal variables into real ones, how inflation affects the economy, and how indexing works. The causes of inflation have barely been hinted at, and government policies to deal with inflation have not been addressed at all. These issues will be taken up in depth in other chapters. However, it is useful to offer a preview here.
The cause of inflation can be summed up in one sentence: Too many dollars chasing too few goods. The great surges of inflation early in the twentieth century came after wars, which are a time when government spending is very high, but consumers have little to buy, because production is going to the war effort. Governments also commonly impose price controls during wartime. After the war, the price controls end and pent-up buying power surges forth, driving up inflation. On the other hand, if too few dollars are chasing too many goods, then inflation will decline or even turn into deflation. Therefore, slowdowns in economic activity, as in major recessions and the Great Depression, are typically associated with a reduction in inflation or even outright deflation.
The policy implications are clear. If inflation is to be avoided, the amount of purchasing power in the economy must grow at roughly the same rate as the production of goods. Macroeconomic policies that the government can use to affect the amount of purchasing power—through taxes, spending, and regulation of interest rates and credit—can thus cause inflation to rise or reduce inflation to lower levels.
A payment is said to be indexed if it is automatically adjusted for inflation. Examples of indexing in the private sector include wage contracts with cost-of-living adjustments (COLAs) and loan agreements like adjustable-rate mortgages (ARMs). Examples of indexing in the public sector include tax brackets and Social Security payments.
 Answer the self check questions below to monitor your understanding of the concepts in this section.
Self Check Questions
- What is the definition of inflation? How is inflation measured?
- What is deflation?
- What are the three levels of inflation? What is creeping inflation?
- Give a historical example of hyperinflation.
- What are 3 possible causes of inflation?
- What are some consequences of inflation?