
9.3: One and Two-Sided Tests of Significance
- Page ID
- 5785
\( \newcommand{\vecs}[1]{\overset { \scriptstyle \rightharpoonup} {\mathbf{#1}} } \)
\( \newcommand{\vecd}[1]{\overset{-\!-\!\rightharpoonup}{\vphantom{a}\smash {#1}}} \)
\( \newcommand{\dsum}{\displaystyle\sum\limits} \)
\( \newcommand{\dint}{\displaystyle\int\limits} \)
\( \newcommand{\dlim}{\displaystyle\lim\limits} \)
\( \newcommand{\id}{\mathrm{id}}\) \( \newcommand{\Span}{\mathrm{span}}\)
( \newcommand{\kernel}{\mathrm{null}\,}\) \( \newcommand{\range}{\mathrm{range}\,}\)
\( \newcommand{\RealPart}{\mathrm{Re}}\) \( \newcommand{\ImaginaryPart}{\mathrm{Im}}\)
\( \newcommand{\Argument}{\mathrm{Arg}}\) \( \newcommand{\norm}[1]{\| #1 \|}\)
\( \newcommand{\inner}[2]{\langle #1, #2 \rangle}\)
\( \newcommand{\Span}{\mathrm{span}}\)
\( \newcommand{\id}{\mathrm{id}}\)
\( \newcommand{\Span}{\mathrm{span}}\)
\( \newcommand{\kernel}{\mathrm{null}\,}\)
\( \newcommand{\range}{\mathrm{range}\,}\)
\( \newcommand{\RealPart}{\mathrm{Re}}\)
\( \newcommand{\ImaginaryPart}{\mathrm{Im}}\)
\( \newcommand{\Argument}{\mathrm{Arg}}\)
\( \newcommand{\norm}[1]{\| #1 \|}\)
\( \newcommand{\inner}[2]{\langle #1, #2 \rangle}\)
\( \newcommand{\Span}{\mathrm{span}}\) \( \newcommand{\AA}{\unicode[.8,0]{x212B}}\)
\( \newcommand{\vectorA}[1]{\vec{#1}} % arrow\)
\( \newcommand{\vectorAt}[1]{\vec{\text{#1}}} % arrow\)
\( \newcommand{\vectorB}[1]{\overset { \scriptstyle \rightharpoonup} {\mathbf{#1}} } \)
\( \newcommand{\vectorC}[1]{\textbf{#1}} \)
\( \newcommand{\vectorD}[1]{\overrightarrow{#1}} \)
\( \newcommand{\vectorDt}[1]{\overrightarrow{\text{#1}}} \)
\( \newcommand{\vectE}[1]{\overset{-\!-\!\rightharpoonup}{\vphantom{a}\smash{\mathbf {#1}}}} \)
\( \newcommand{\vecs}[1]{\overset { \scriptstyle \rightharpoonup} {\mathbf{#1}} } \)
\(\newcommand{\longvect}{\overrightarrow}\)
\( \newcommand{\vecd}[1]{\overset{-\!-\!\rightharpoonup}{\vphantom{a}\smash {#1}}} \)
\(\newcommand{\avec}{\mathbf a}\) \(\newcommand{\bvec}{\mathbf b}\) \(\newcommand{\cvec}{\mathbf c}\) \(\newcommand{\dvec}{\mathbf d}\) \(\newcommand{\dtil}{\widetilde{\mathbf d}}\) \(\newcommand{\evec}{\mathbf e}\) \(\newcommand{\fvec}{\mathbf f}\) \(\newcommand{\nvec}{\mathbf n}\) \(\newcommand{\pvec}{\mathbf p}\) \(\newcommand{\qvec}{\mathbf q}\) \(\newcommand{\svec}{\mathbf s}\) \(\newcommand{\tvec}{\mathbf t}\) \(\newcommand{\uvec}{\mathbf u}\) \(\newcommand{\vvec}{\mathbf v}\) \(\newcommand{\wvec}{\mathbf w}\) \(\newcommand{\xvec}{\mathbf x}\) \(\newcommand{\yvec}{\mathbf y}\) \(\newcommand{\zvec}{\mathbf z}\) \(\newcommand{\rvec}{\mathbf r}\) \(\newcommand{\mvec}{\mathbf m}\) \(\newcommand{\zerovec}{\mathbf 0}\) \(\newcommand{\onevec}{\mathbf 1}\) \(\newcommand{\real}{\mathbb R}\) \(\newcommand{\twovec}[2]{\left[\begin{array}{r}#1 \\ #2 \end{array}\right]}\) \(\newcommand{\ctwovec}[2]{\left[\begin{array}{c}#1 \\ #2 \end{array}\right]}\) \(\newcommand{\threevec}[3]{\left[\begin{array}{r}#1 \\ #2 \\ #3 \end{array}\right]}\) \(\newcommand{\cthreevec}[3]{\left[\begin{array}{c}#1 \\ #2 \\ #3 \end{array}\right]}\) \(\newcommand{\fourvec}[4]{\left[\begin{array}{r}#1 \\ #2 \\ #3 \\ #4 \end{array}\right]}\) \(\newcommand{\cfourvec}[4]{\left[\begin{array}{c}#1 \\ #2 \\ #3 \\ #4 \end{array}\right]}\) \(\newcommand{\fivevec}[5]{\left[\begin{array}{r}#1 \\ #2 \\ #3 \\ #4 \\ #5 \\ \end{array}\right]}\) \(\newcommand{\cfivevec}[5]{\left[\begin{array}{c}#1 \\ #2 \\ #3 \\ #4 \\ #5 \\ \end{array}\right]}\) \(\newcommand{\mattwo}[4]{\left[\begin{array}{rr}#1 \amp #2 \\ #3 \amp #4 \\ \end{array}\right]}\) \(\newcommand{\laspan}[1]{\text{Span}\{#1\}}\) \(\newcommand{\bcal}{\cal B}\) \(\newcommand{\ccal}{\cal C}\) \(\newcommand{\scal}{\cal S}\) \(\newcommand{\wcal}{\cal W}\) \(\newcommand{\ecal}{\cal E}\) \(\newcommand{\coords}[2]{\left\{#1\right\}_{#2}}\) \(\newcommand{\gray}[1]{\color{gray}{#1}}\) \(\newcommand{\lgray}[1]{\color{lightgray}{#1}}\) \(\newcommand{\rank}{\operatorname{rank}}\) \(\newcommand{\row}{\text{Row}}\) \(\newcommand{\col}{\text{Col}}\) \(\renewcommand{\row}{\text{Row}}\) \(\newcommand{\nul}{\text{Nul}}\) \(\newcommand{\var}{\text{Var}}\) \(\newcommand{\corr}{\text{corr}}\) \(\newcommand{\len}[1]{\left|#1\right|}\) \(\newcommand{\bbar}{\overline{\bvec}}\) \(\newcommand{\bhat}{\widehat{\bvec}}\) \(\newcommand{\bperp}{\bvec^\perp}\) \(\newcommand{\xhat}{\widehat{\xvec}}\) \(\newcommand{\vhat}{\widehat{\vvec}}\) \(\newcommand{\uhat}{\widehat{\uvec}}\) \(\newcommand{\what}{\widehat{\wvec}}\) \(\newcommand{\Sighat}{\widehat{\Sigma}}\) \(\newcommand{\lt}{<}\) \(\newcommand{\gt}{>}\) \(\newcommand{\amp}{&}\) \(\definecolor{fillinmathshade}{gray}{0.9}\)How many tails are there in the test for the claim: “Less than 5% of high school students are familiar with the tails of a distribution?”
Tails
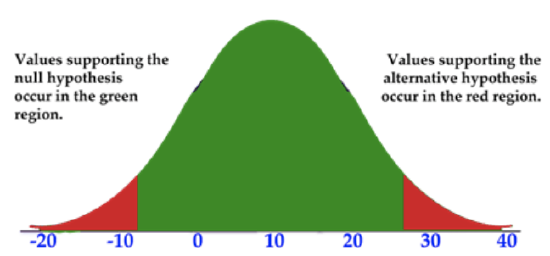
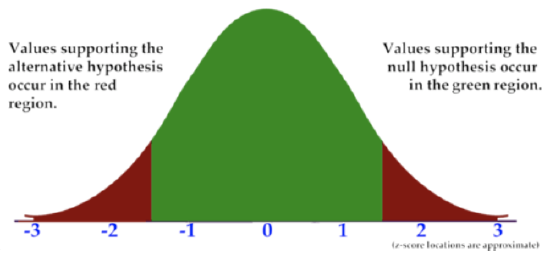
The “tails” of a test are the values outside of the critical values. In other words, the tails are the ends of the distribution, and they begin at the greatest or least value included in the alternative hypothesis (the critical values).
In the graph below, the tails are in red and the rest of the distribution is in green. The critical values of the test in the image are -8 and 28, as these are the dividers between values supporting the alternative and null hypothesis. The area in red can also be seen as the rejection region, since an observed value in this region indicates that the null hypothesis be rejected.
CK-12 Foundation, Larame Spence - CK-12 Foundation - CC BY-NC-SA
There are three types of test from a “tails” standpoint:
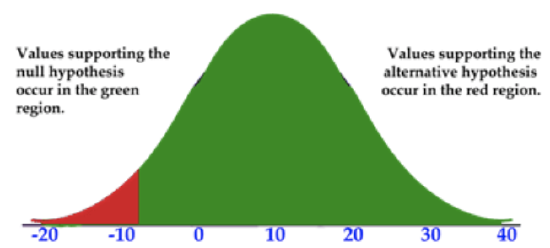
- A left-tailed test only has a tail on the left side of the graph:
CK-12 Foundation, Larame Spence - CK-12 Foundation - CC BY-NC-SA
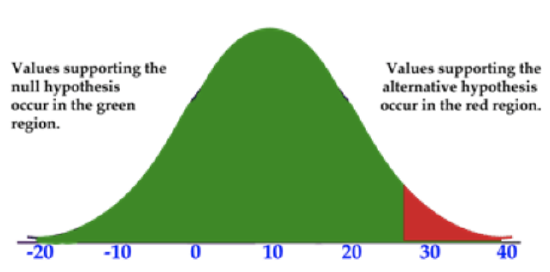
- A right-tailed test only has a tail on the right side of the graph:
CK-12 Foundation, Larame Spence - CK-12 Foundation - CC BY-NC-SA
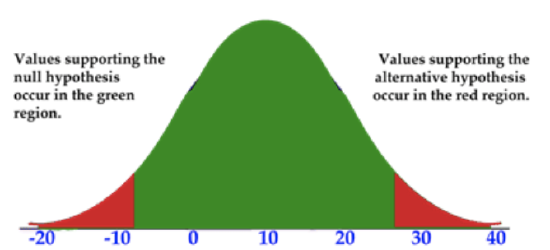
- A two-tailed test has tails on both ends of the graph. This is a test where the null hypothesis is a claim of a specific value. For example: H0:X=5
CK-12 Foundation, Larame Spence - CK-12 Foundation - CC BY-NC-SA
Determining the Null Hypothesis and Kind of Test
1. A researcher claims that black horses are, on average, more than 30 lbs heavier than white horses, which average 1100 lbs. What is the null hypothesis, and what kind of test is this?
The null hypothesis would be notated H0:μ≤1130 lbs
This is a right-tailed test, since the tail of the graph would be on the right. Recognize that values above 1130 would indicate that the null hypothesis be rejected, and the red area represents the rejection region.
2. A package of gum claims that the flavor lasts more than 39 minutes. What would be the null hypothesis of a test to determine the validity of the claim? What sort of test is this?
The null hypothesis would by notated as H0:μ≤39.
This is a right-tailed test, since the rejection region would consist of values greater than 39.
3. An ice pack claims to stay cold between 35 and 65 minutes. What would be the null hypothesis of a test to determine the validity of the claim? What sort of test would it be?
The null hypothesis would be H0:35>μ∪μ>65.
This is a two-tailed test, since the null hypothesis contains the values above and below a given range.
Earlier Problem Revisited
How many tails are there in the test for the claim: “Less than 5% of high school students are familiar with hypothesis tails?”
This is a left-tailed test, since the null hypothesis is H0:X≥5% meaning that the rejection region contains only values below a given value.
Examples
For each question: a) State the null and alternative hypothesis for a test to determine the validity of the claim, and b) Identify left, right, or two-tailed test type.
Example 1
The weatherman claims an average of 2" - 2.5" of snow throughout the country.
a) H1:2′′<μ<2.5′′ and H0:2′′>μ∪μ>2.5′′
b) This is a two-tailed test, since the rejection region is at the ends of the graph.
Example 2
The average Siberian Husky weighs more than 35 pounds.
a) H1:μ>35 lbs and H0:35 lbs≥μ
b) This is a right-tailed test, since the rejection region is located on the right end of the graph.
Example 3
The United Parcel Service claims less then 5-day shipping times for ground packages.
a) H1:μ<5 days and H0:μ≥5 days
b) This is a left-tailed test, since the ‘reject’ values are on the left end of the graph.
Review
For each question: a) State the null and alternative hypothesis for a test to determine the validity of the claim, and b) Identify left, right, or two-tailed test type.
- The average miniature horse is less than 34 inches at the shoulder. Tiny Equines claims that their miniature horses are an average of 3 inches less than the breed average.
- Speedy Solutions is a delivery company that claims all deliveries average less than 72 hours.
- Terrific Textiles claims that 45% to 55% of t-shirts sold in CO are red.
- Gas Hater Car Sales claims that 70% or more of the cars on the lot average more than 40 mpg.
- The 2011 average service time for Fast Fatz Burgers was 56 seconds. The store manager claims that the 2012 average is more than 5 seconds faster.
- Colorful Cavity Causers sells multi-colored candies by the bag. Each bag is claimed to average between 5.5 and 6.5 oz.
- Aaron works for an electronics company, quality-testing batteries. The company claims a minimum of 5 hrs battery life.
- The lessons in this Probability and Statistics text average 13 practice problems each.
- The outside temperature in Maui averages between 72 and 83 degrees year-round.
- 72% of elementary school teachers are female.
 CK-12 Foundation, Larame Spence - CK-12 Foundation
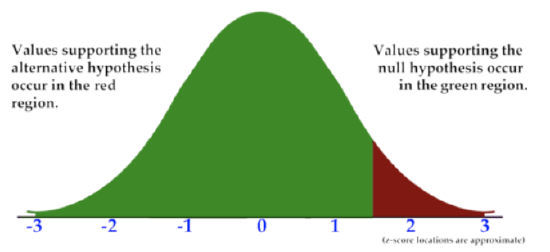 CK-12 Foundation, Larame Spence - CK-12 Foundation
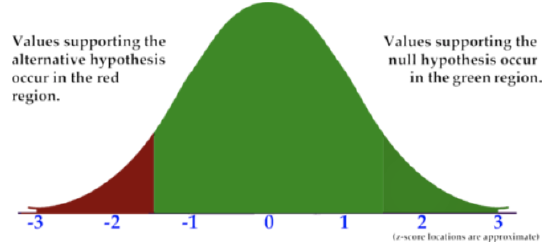 CK-12 Foundation, Larame Spence - CK-12 Foundation
Vocabulary
| Term | Definition |
|---|---|
| critical regions | Critical regions (or rejection regions) describe the entire area of values that indicate you reject the null hypothesis. |
| left-tailed test | A left-tailed test is identified by a rejection region (tail) only on the left side of a normal distribution curve. |
| right-tailed test | A right-tailed test only has a tail on the right side of the normal distribution curve. |
| two-tailed test | A two-tailed test has tails on both ends of the normal distribution curve. The null hypothesis will be in the form Ho = 5, for example. |